Text Solution
Verified by Experts


Topper's Solved these Questions
Similar Questions
Explore conceptually related problems
RS AGGARWAL-PRESENTATION OF DATA IN TABULAR FORM-Multiple Choice Questions (Mcq)
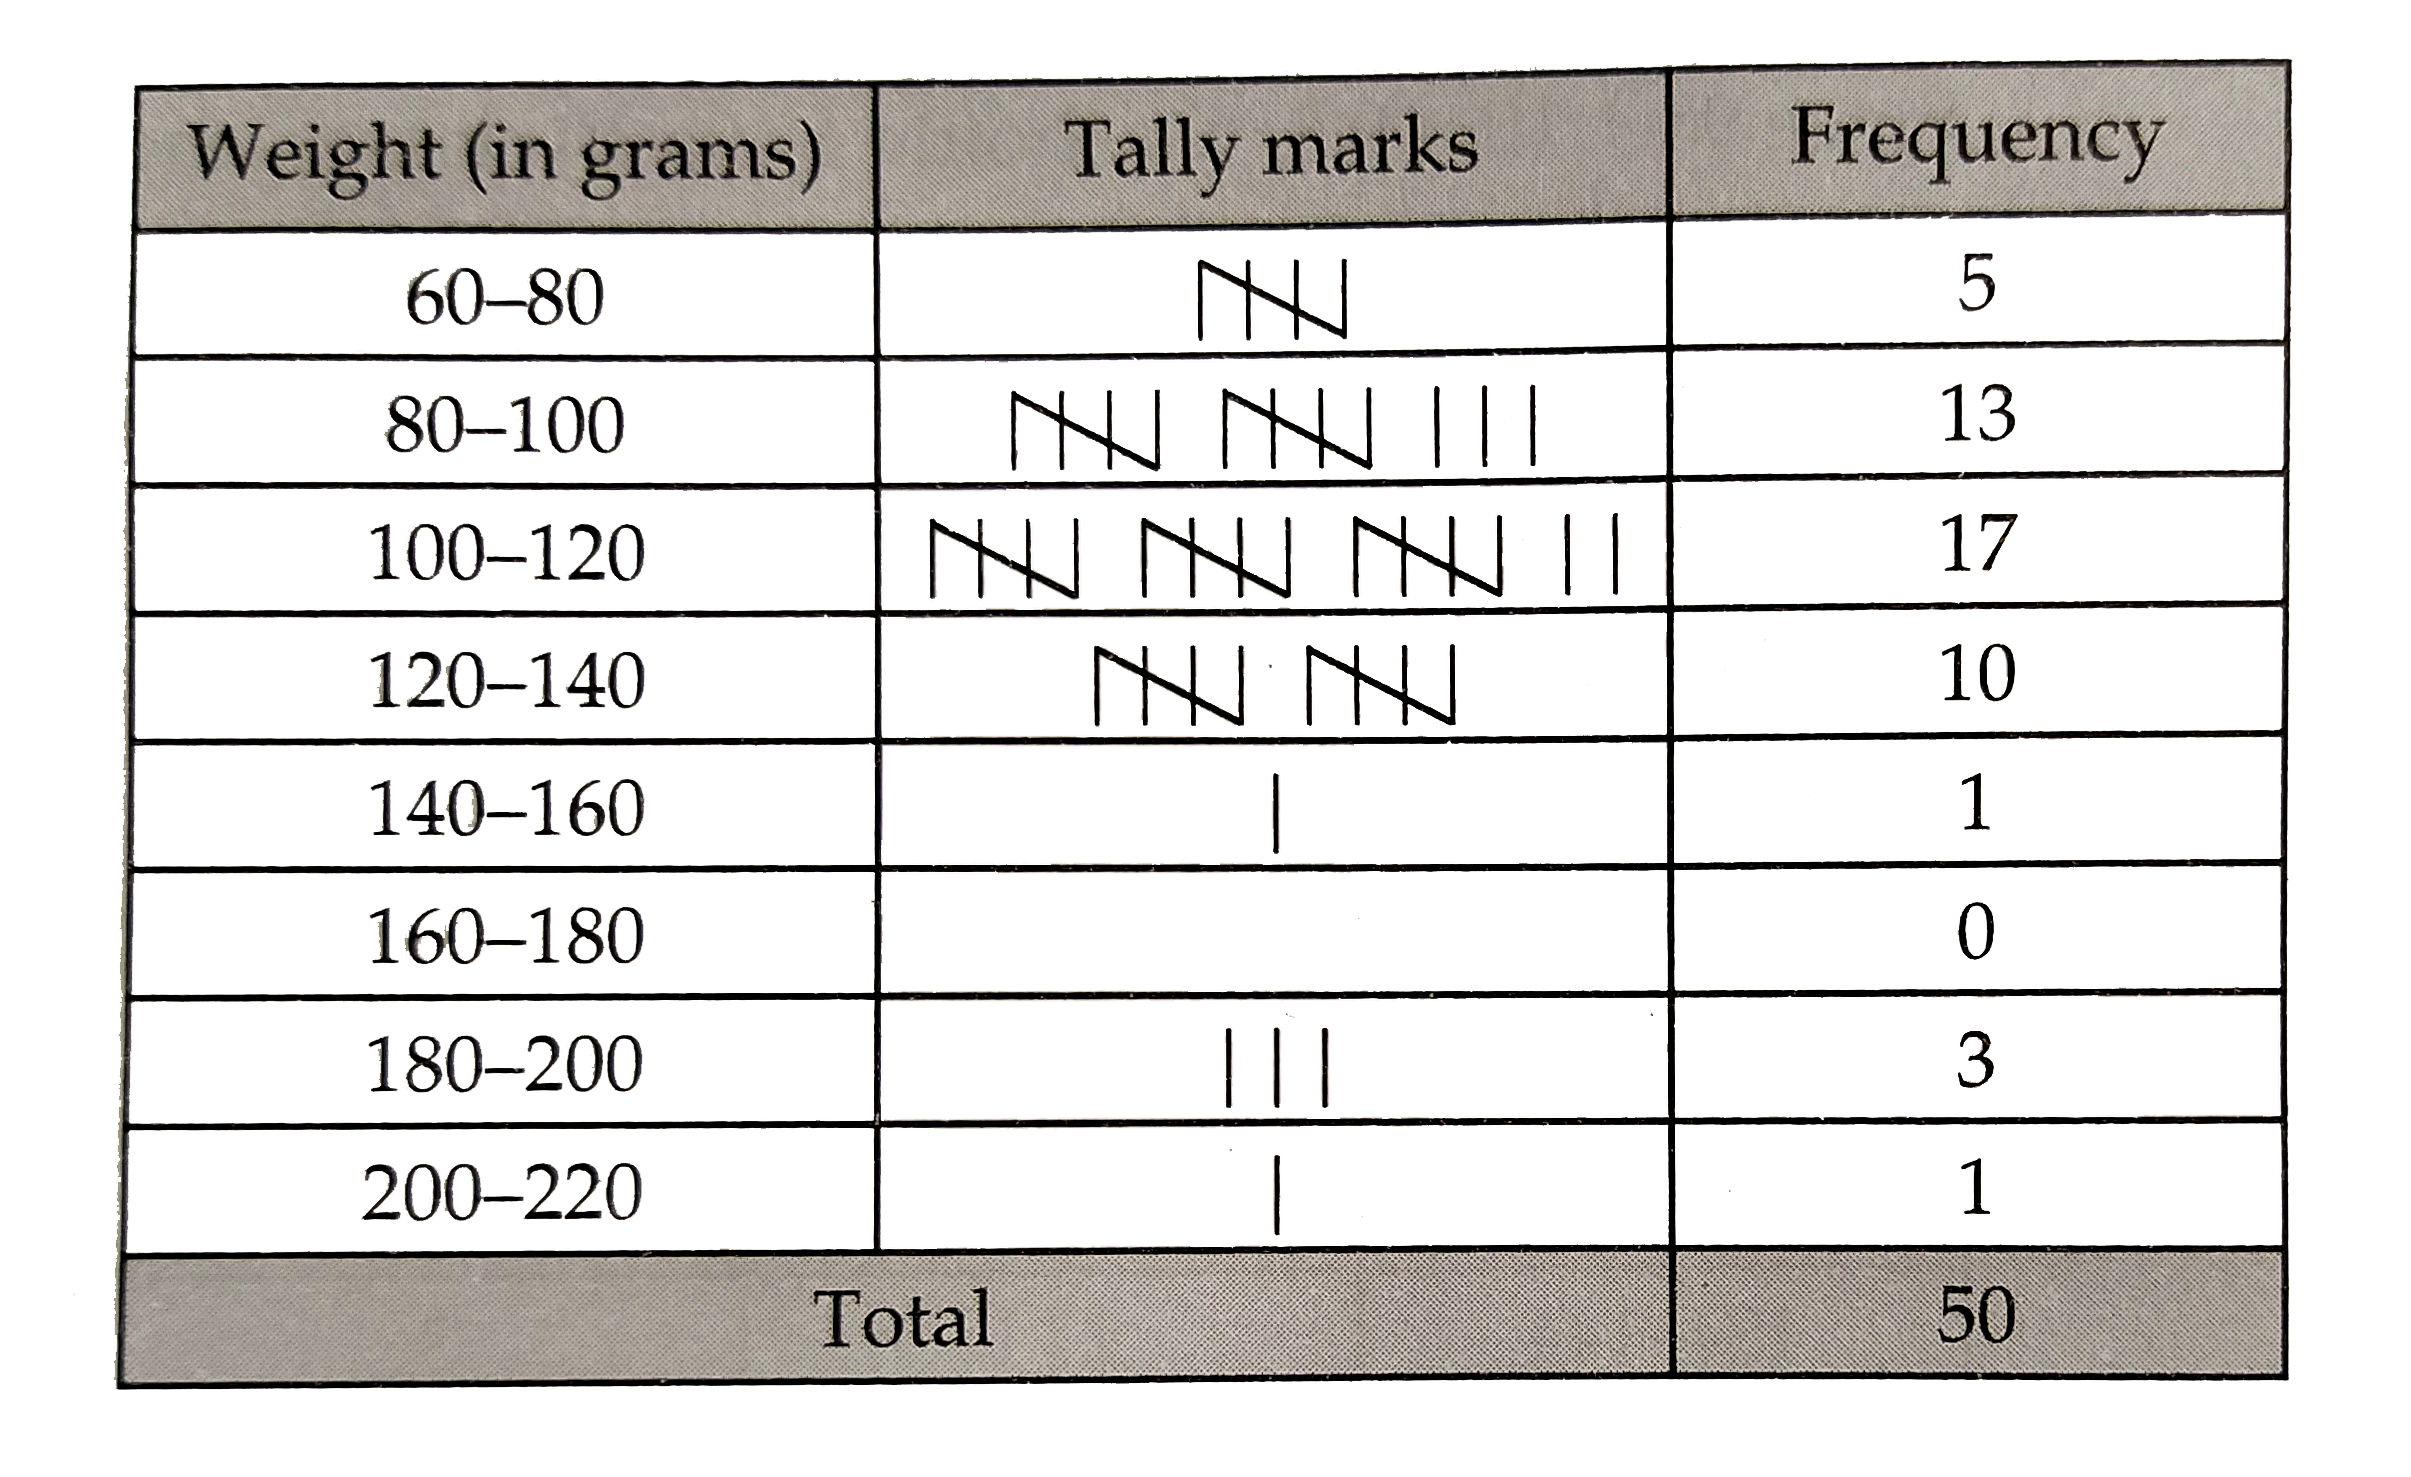
- The weights in grams of 50 oranges picked at random from a consignm...
Text Solution
|
- The range of the data <b> 12,25,15,18,17,20,22,0,16,11,8,19,10,30,20...
Text Solution
|
- The class mark of the class 100-120 is
Text Solution
|
- In the class interval 10-20, 20-30, the number is 20 is included in :-
Text Solution
|
- The class marks of a frequency distribution are given as follows 15,20...
Text Solution
|
- In a frequency distribution, the mid values of a class is 10 and width...
Text Solution
|
- The mid value of a class interval is 32 and the class size is 10 then ...
Text Solution
|
- If m is the mid-point and u is the upper limit of a class in a continu...
Text Solution
|
- The width of each of five continuous classes in a frequency distributi...
Text Solution
|
- Let L be the lower class boundary of a class in a frequency distributi...
Text Solution
|