Text Solution
Verified by Experts
The correct Answer is:


Topper's Solved these Questions
MEAN , MEDIAN AND MODE OF UNGROUPED DATA
RS AGGARWAL|Exercise Exercise 18C|10 VideosMEAN , MEDIAN AND MODE OF UNGROUPED DATA
RS AGGARWAL|Exercise Exercise 18D|8 VideosMEAN , MEDIAN AND MODE OF UNGROUPED DATA
RS AGGARWAL|Exercise Exercise 18A|31 VideosLINES AND ANGLES
RS AGGARWAL|Exercise Multiple Choice Questions (Mcq)|28 VideosNUMBER SYSTEMS
RS AGGARWAL|Exercise Very Short Answer Questions|23 Videos
Similar Questions
Explore conceptually related problems
RS AGGARWAL-MEAN , MEDIAN AND MODE OF UNGROUPED DATA -Exercise 18B
- Obtain the mean of the following distribution :
Text Solution
|
- The following table shows the weights of 12 workers in a factory : ...
Text Solution
|
- The measurements ( in mm) of the diameters of the heads of 50 screws a...
Text Solution
|
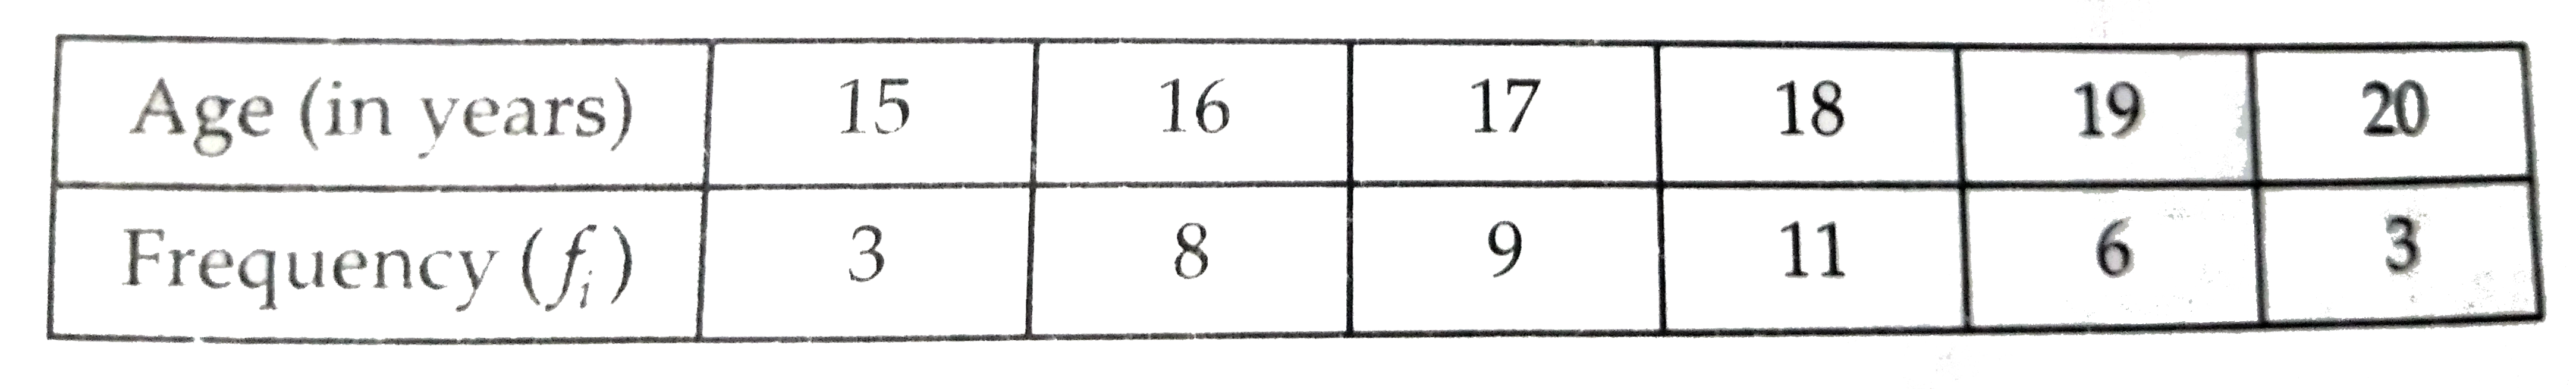
- The followings data give the number of boys of a particular age in a c...
Text Solution
|
- Find the mean of the followings frequency distribution :
Text Solution
|
- Find the mean of daily wages of 40 workers in a factory as per data gi...
Text Solution
|
- If the mean of the following dat is 20.2, then find the value of p.
Text Solution
|
- The mean of the following data is 8. Then, the value of p is
Text Solution
|
- Find the missing frequency p for the following frequency distributions...
Text Solution
|
- Find the value of p for the following frequency distribution whose mea...
Text Solution
|
- Find the missing frequencies in the following frequency distribution w...
Text Solution
|
- Find the missing frequencies in the following frequncy distribution wh...
Text Solution
|
- Find the value of p, when the following distribution is 20.
Text Solution
|
- The mean of the following distribution is 50. Find the value of a...
Text Solution
|