Text Solution
Verified by Experts


Topper's Solved these Questions
MEAN,MEDAN,MODE OF GROUPED,DATA CUMULATIVE FREQUENCY GRAPH AND OGIVE
RS AGGARWAL|Exercise MISCELLANEOUS QUESTIONS ON MEAN,MODE AND MEDIAN|1 VideosMEAN,MEDAN,MODE OF GROUPED,DATA CUMULATIVE FREQUENCY GRAPH AND OGIVE
RS AGGARWAL|Exercise Exercise 18A|2 VideosMEAN,MEDAN,MODE OF GROUPED,DATA CUMULATIVE FREQUENCY GRAPH AND OGIVE
RS AGGARWAL|Exercise Test Yourself|18 VideosLINEAR EQUATIONS IN TWO VARIABLES
RS AGGARWAL|Exercise QUESTION|2 VideosPERIMETER AND AREA OF PLANE FIGURES
RS AGGARWAL|Exercise TEST YOURSELF (SHORT -ANSWER QUESTIONS)|1 Videos
Similar Questions
Explore conceptually related problems
RS AGGARWAL-MEAN,MEDAN,MODE OF GROUPED,DATA CUMULATIVE FREQUENCY GRAPH AND OGIVE -SOLVED EXAMPLES
- Find the median of the following data
Text Solution
|
- Find the median wage from the following data
Text Solution
|
- Find the median for the following frequency distributution
Text Solution
|
- Given below is the distribution of IQ of 100 students . Find the media...
Text Solution
|
- Calculate the median class for the following data
Text Solution
|
- Find the missing frequencies in the following frequencies distribution...
Text Solution
|
- Find the mode of the following data
Text Solution
|
- The distribution of sale of shirts sold in a month in a departmental s...
Text Solution
|
- Given below is the frequency distribution of the heights pof the playe...
Text Solution
|
- The following table shows the ages of the patients admitted in hospita...
Text Solution
|
- The mode of the following series is 36 . Find the missing frequency in...
Text Solution
|
- Compare the modal ages of two groups of students appearing for an ent...
Text Solution
|
- The following table shows the marks obtained by 100 students of Class ...
Text Solution
|
- Following is the age distribution of a group of a student . Draw the c...
Text Solution
|
- For the following frequency distribution , draw a cumulative frequency...
Text Solution
|
- The following table gives production yield per hectare of wheat of 100...
Text Solution
|
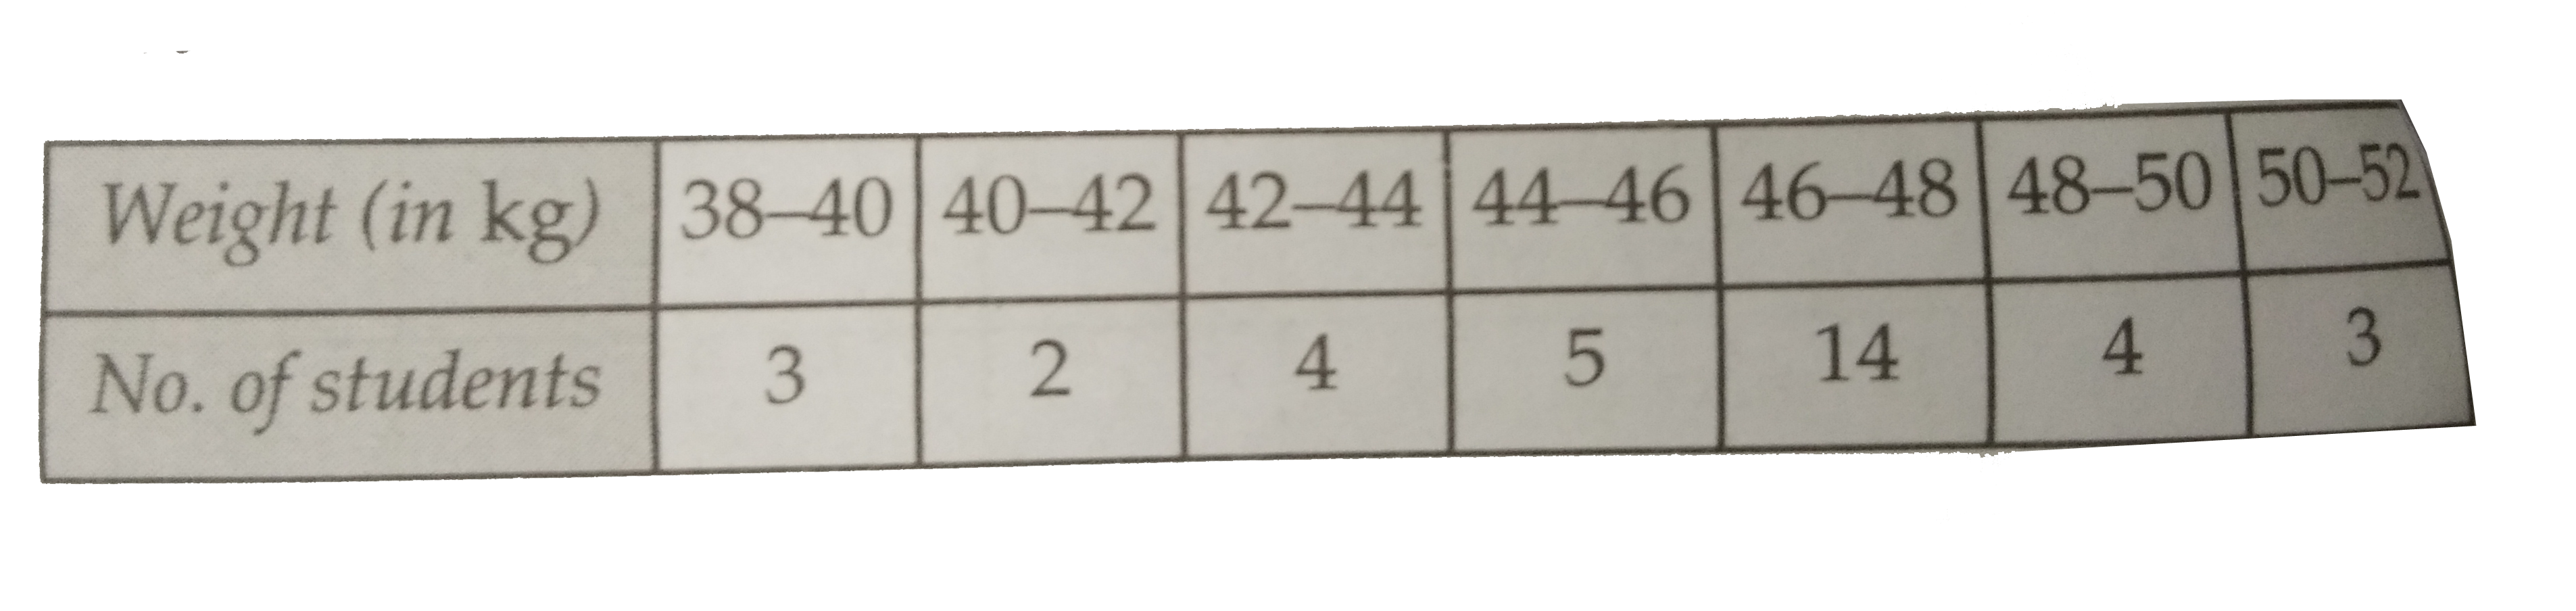
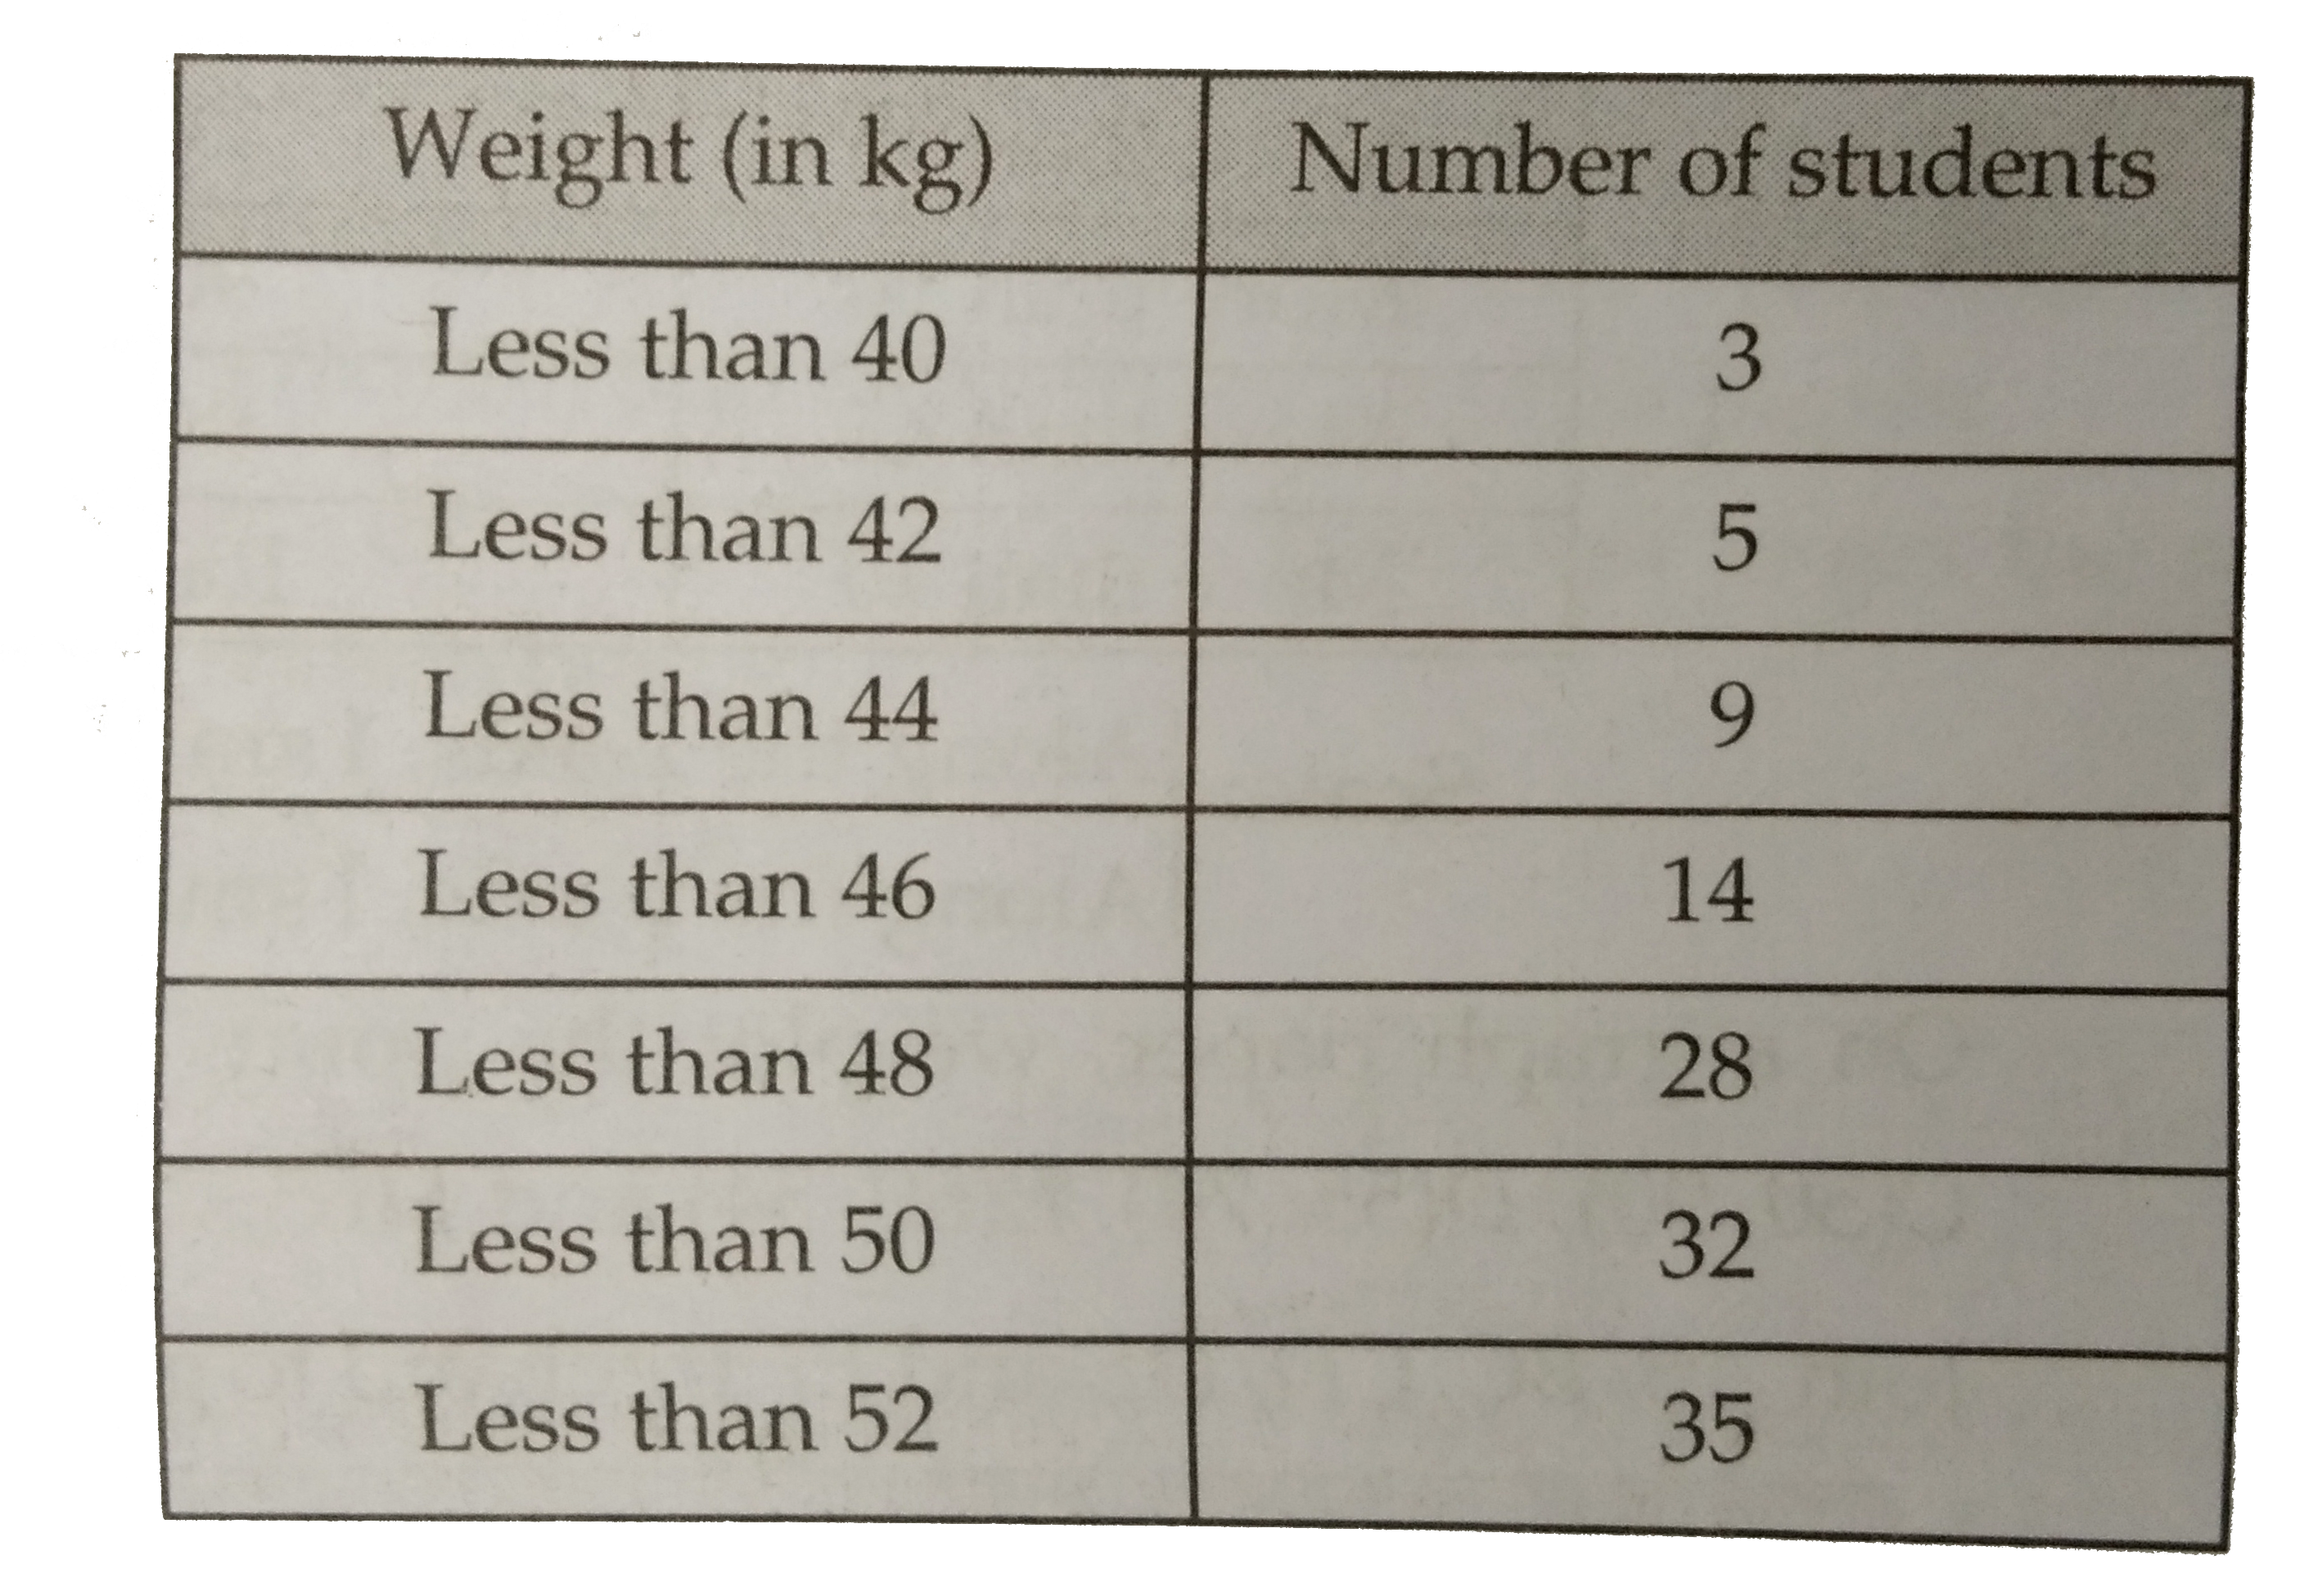
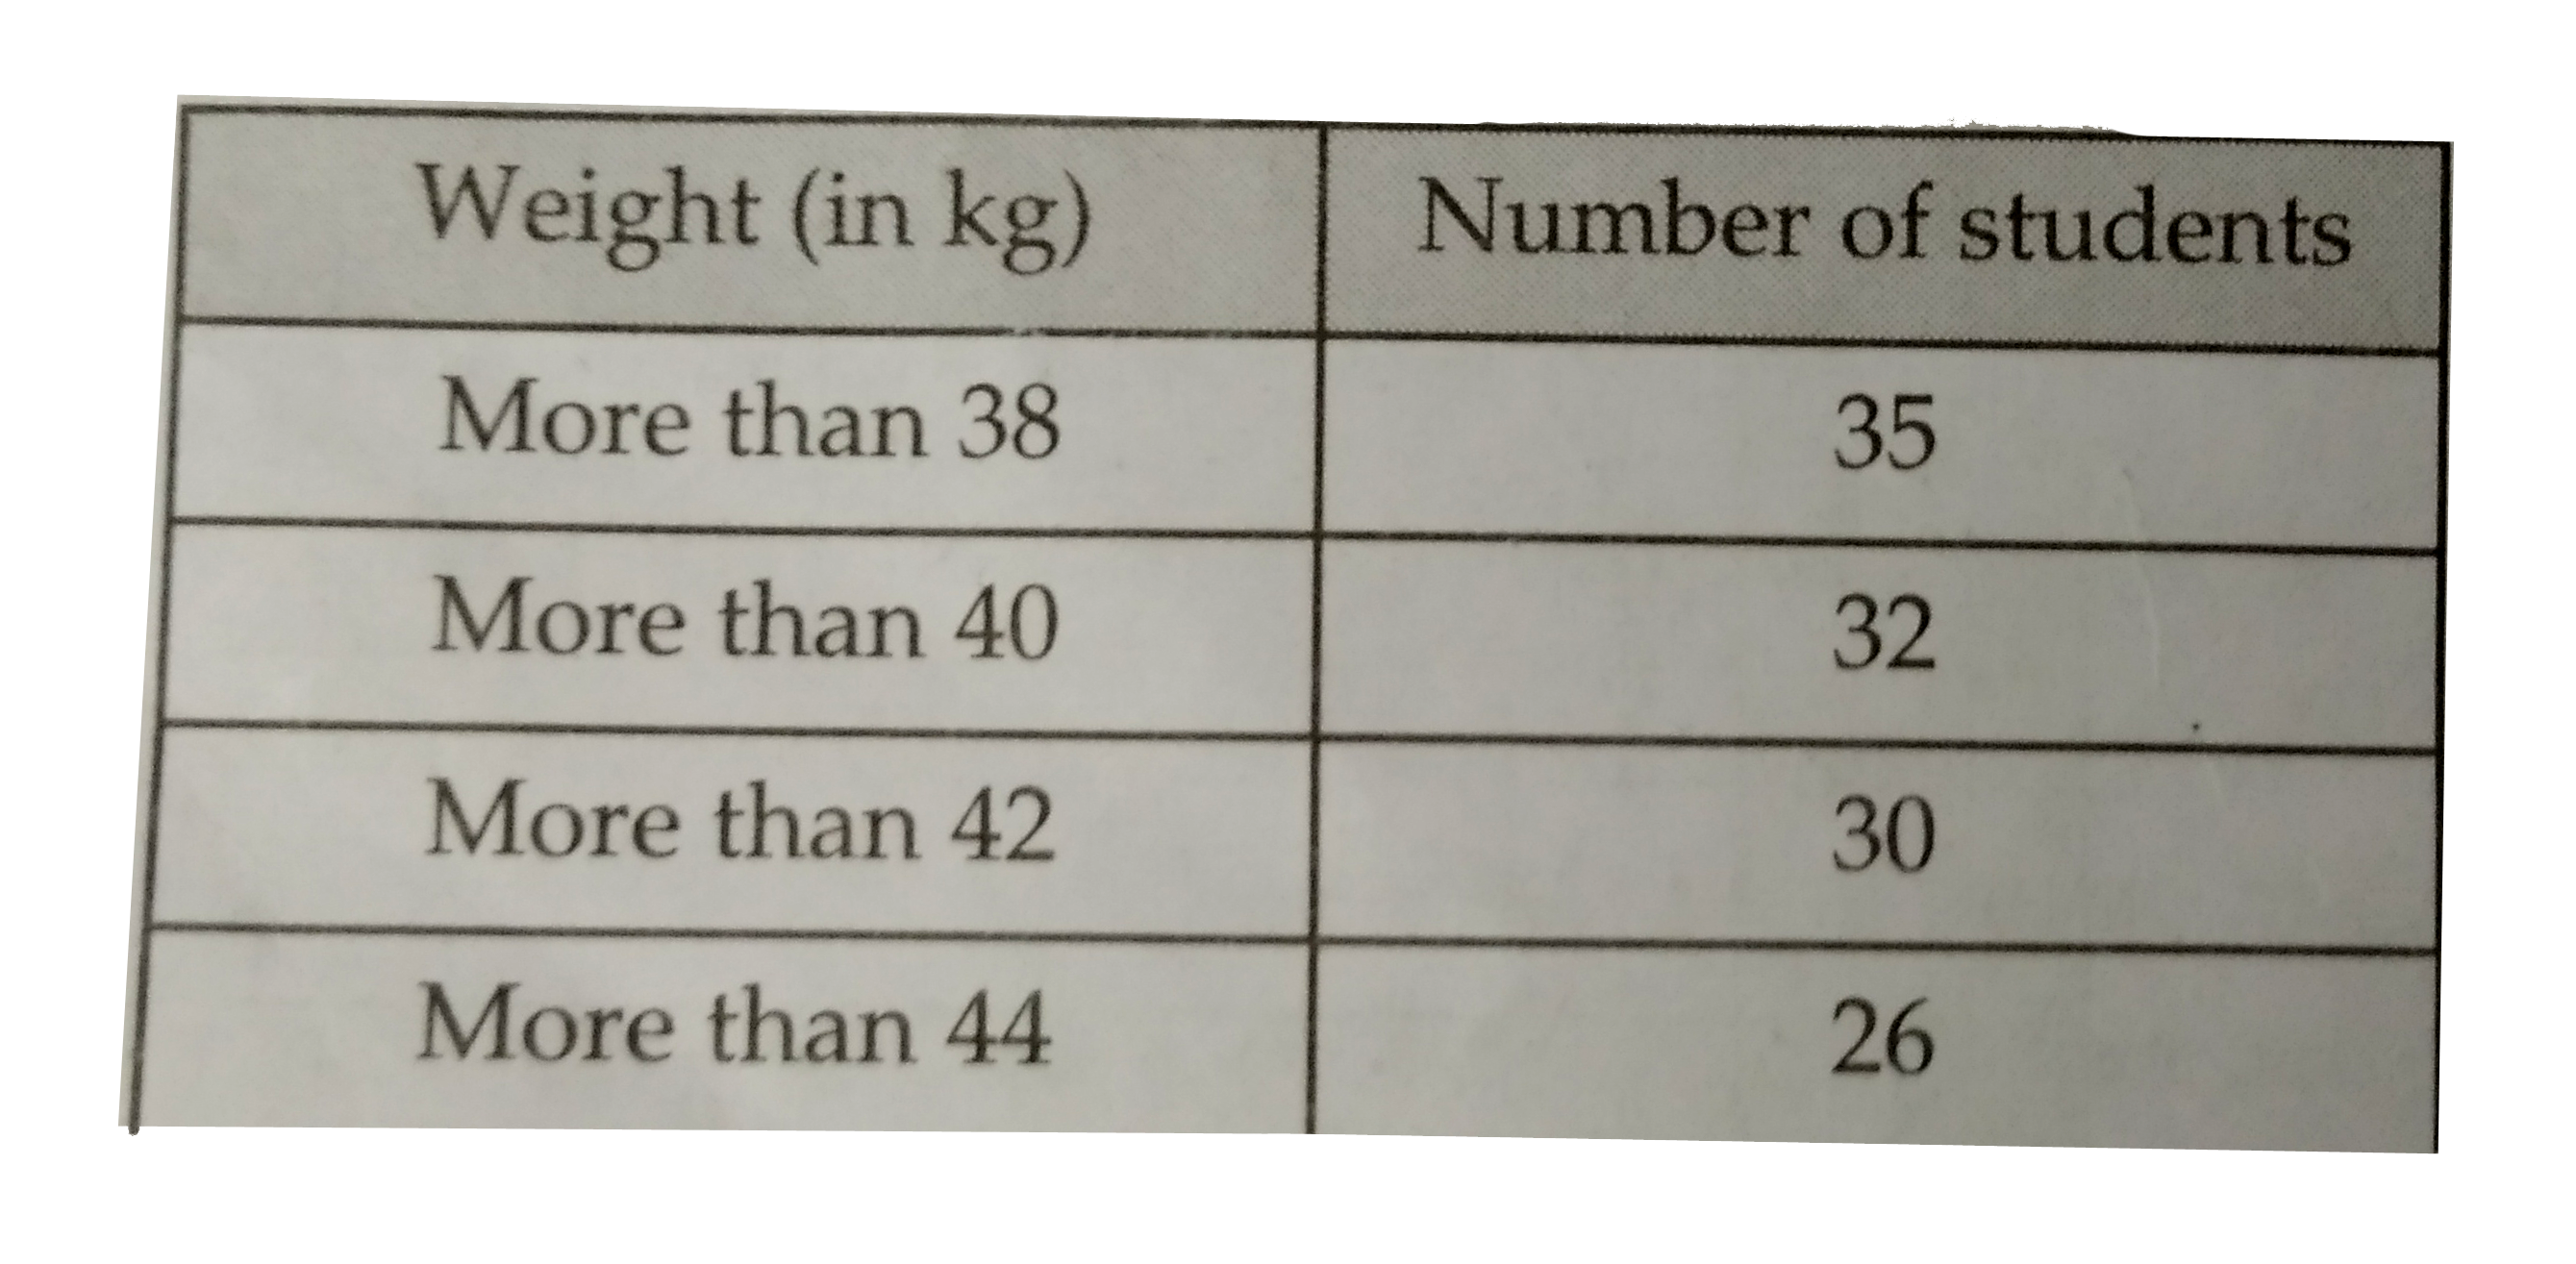
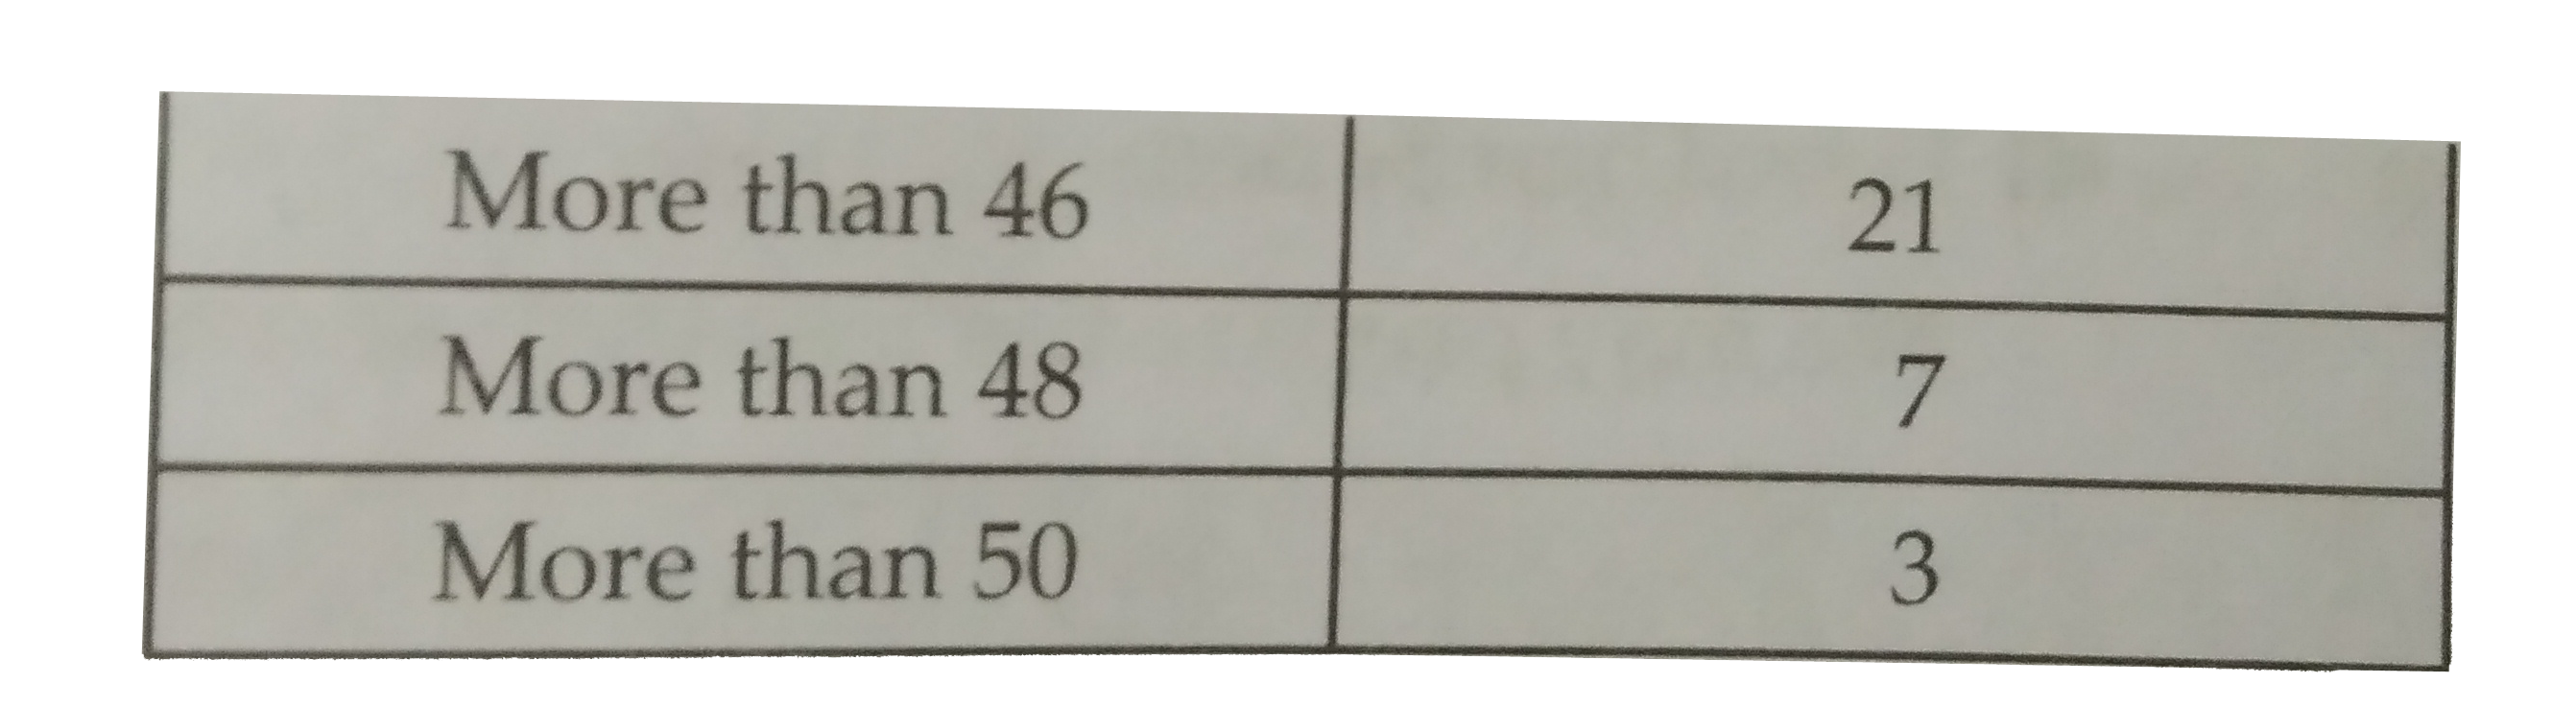
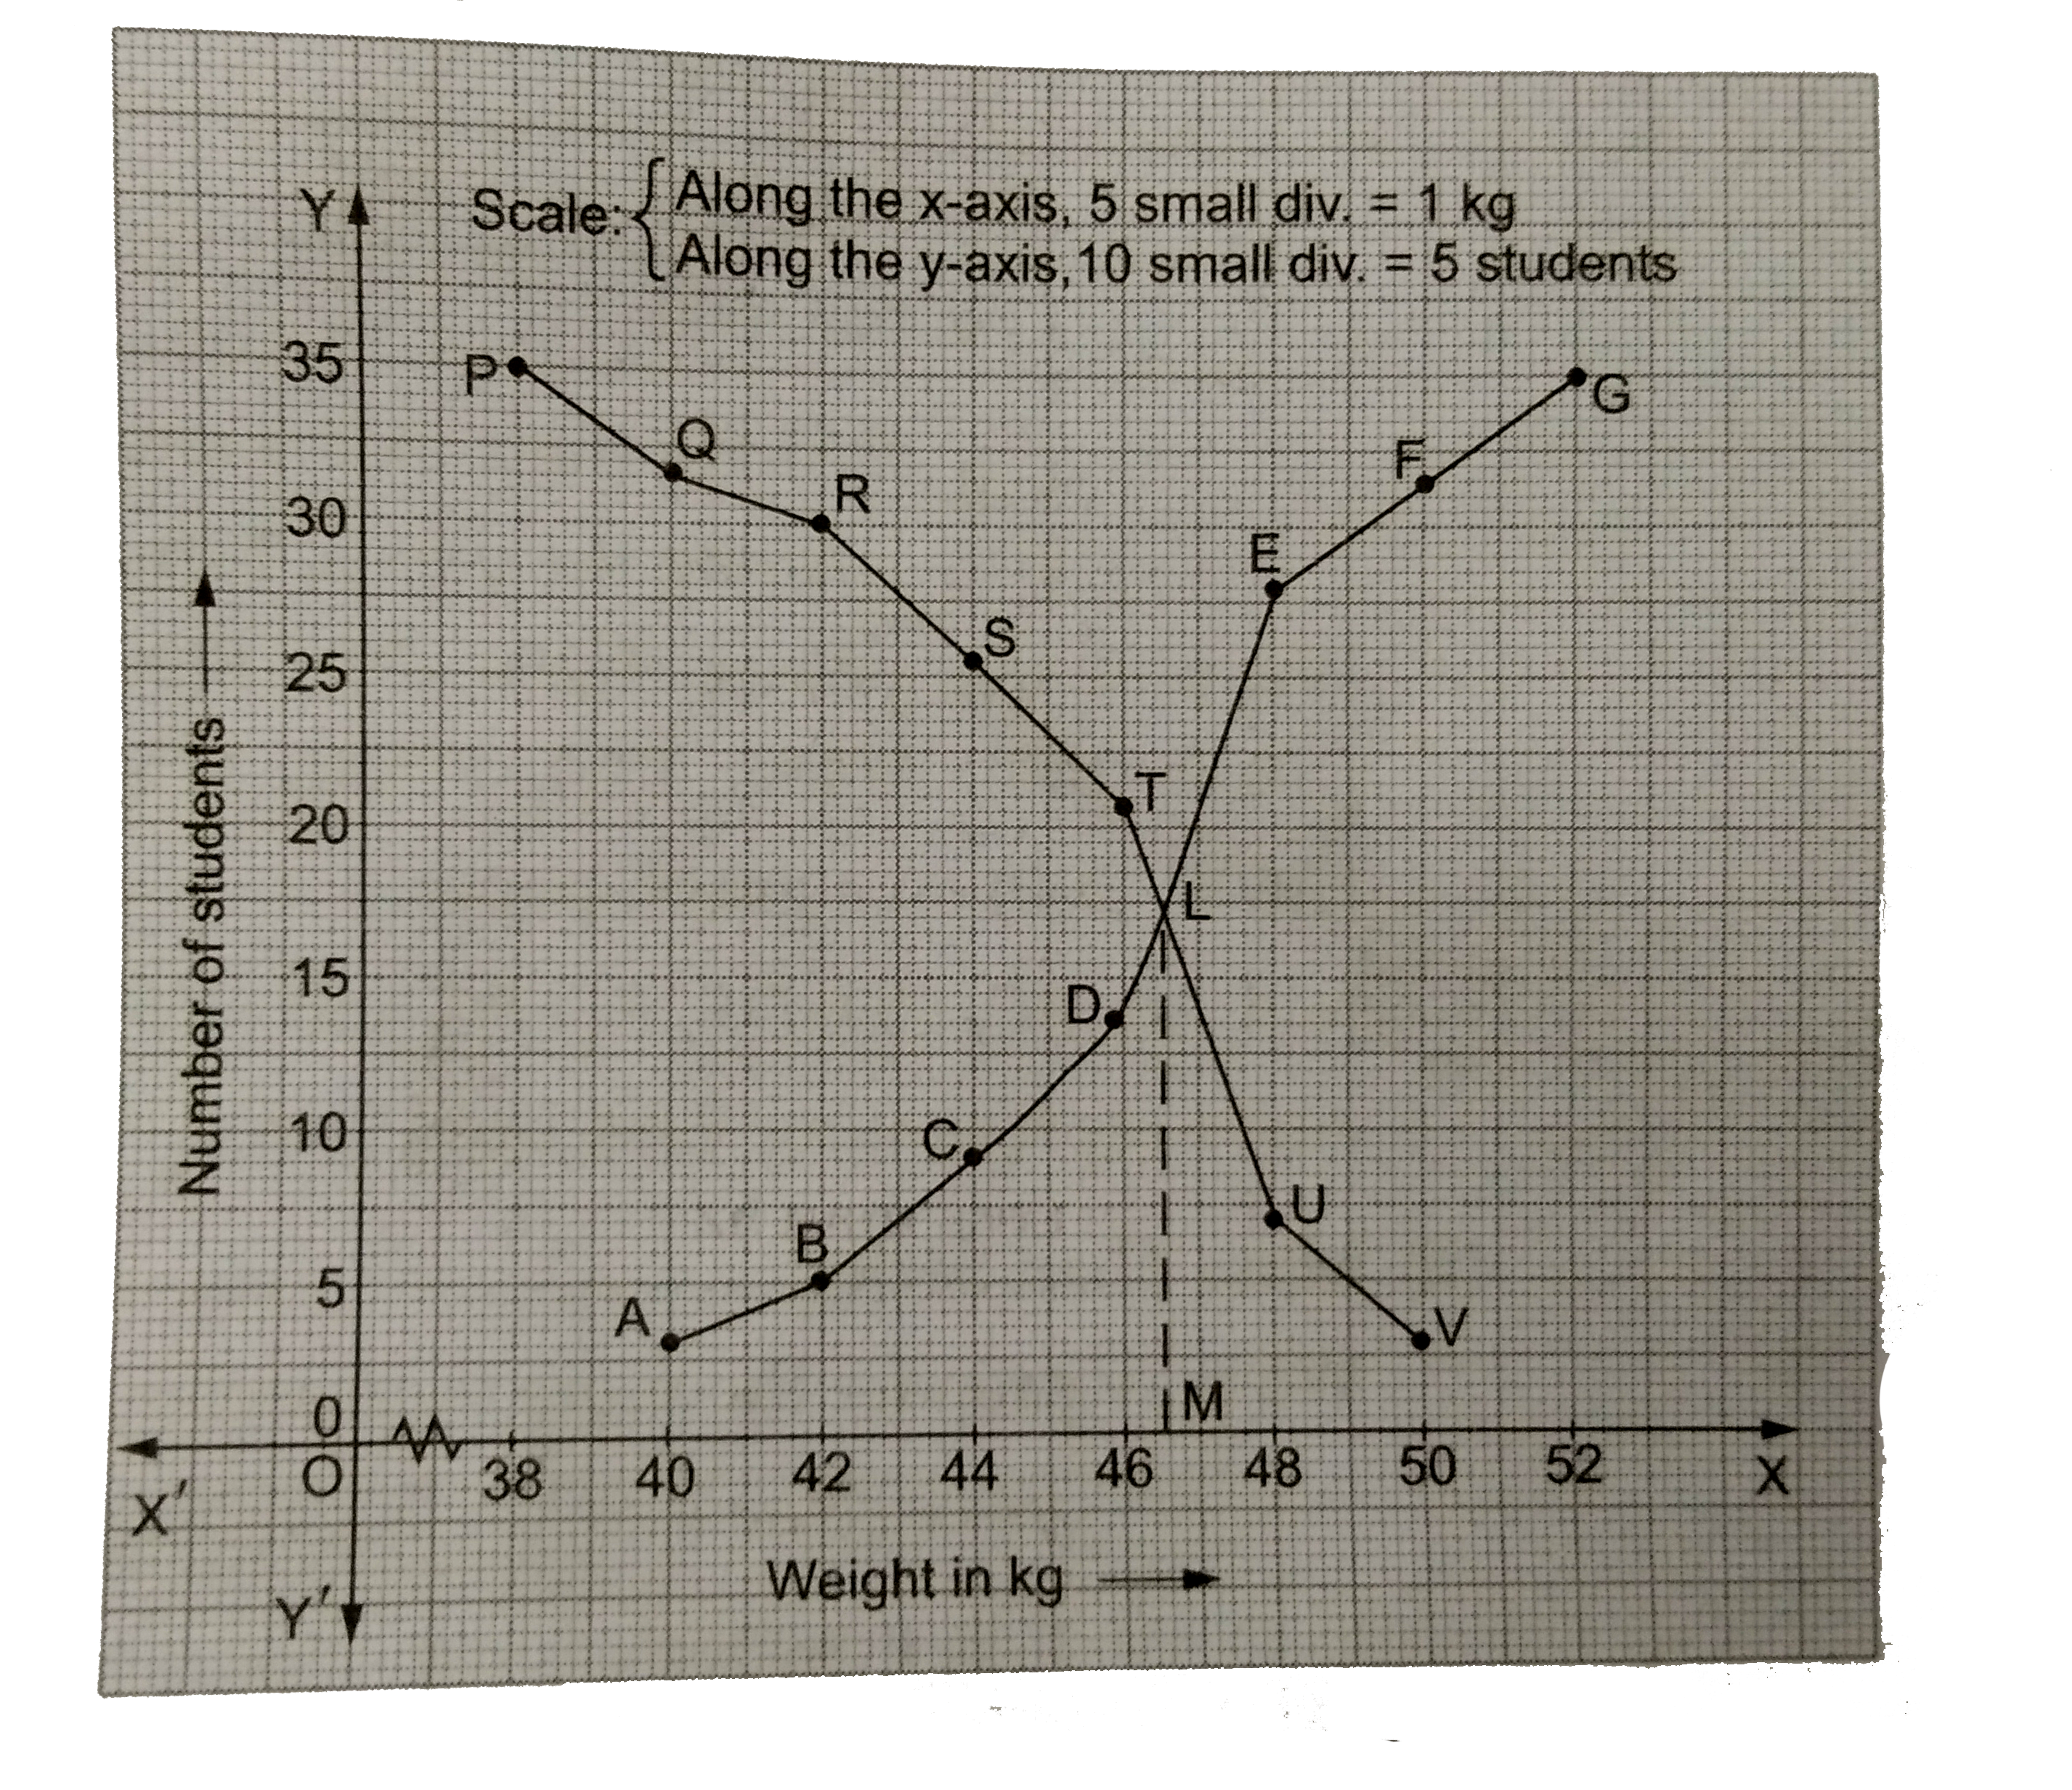
- During the medical check-up of 35 students of a class their weights we...
Text Solution
|
- The table given below shows the frequency distribution of the scores o...
Text Solution
|