


Topper's Solved these Questions
MEAN,MEDAN,MODE OF GROUPED,DATA CUMULATIVE FREQUENCY GRAPH AND OGIVE
RS AGGARWAL|Exercise EXERCISE 18 B|14 VideosMEAN,MEDAN,MODE OF GROUPED,DATA CUMULATIVE FREQUENCY GRAPH AND OGIVE
RS AGGARWAL|Exercise EXERCISE 18 C|10 VideosMEAN,MEDAN,MODE OF GROUPED,DATA CUMULATIVE FREQUENCY GRAPH AND OGIVE
RS AGGARWAL|Exercise Exercise 18A|2 VideosLINEAR EQUATIONS IN TWO VARIABLES
RS AGGARWAL|Exercise QUESTION|2 VideosPERIMETER AND AREA OF PLANE FIGURES
RS AGGARWAL|Exercise TEST YOURSELF (SHORT -ANSWER QUESTIONS)|1 Videos
Similar Questions
Explore conceptually related problems
RS AGGARWAL-MEAN,MEDAN,MODE OF GROUPED,DATA CUMULATIVE FREQUENCY GRAPH AND OGIVE -EXERCISE 18 A
- If the mean of the following frequency distribution is 24, find the va...
Text Solution
|
- The following distrubution shows the daily pocket allowance or childer...
Text Solution
|
- If the mean of the following frequency distribution is 54, find the va...
Text Solution
|
- The mean of the following data is 42 Find the missing frequencies x an...
Text Solution
|
- The daily expenditure of 100 families are given below. Calculate f1 an...
Text Solution
|
- The mean of the following frequency distrubution is 57.6 and the total...
Text Solution
|
- During a medical check-up the number of heartbeates per minute of 30 p...
Text Solution
|
- Find the mean of the following frequency distribution , using the assu...
Text Solution
|
- Find the mean of the following frequency distribution , using the assu...
Text Solution
|
- Find the mean of the following data, using the assumed- mean method :
Text Solution
|
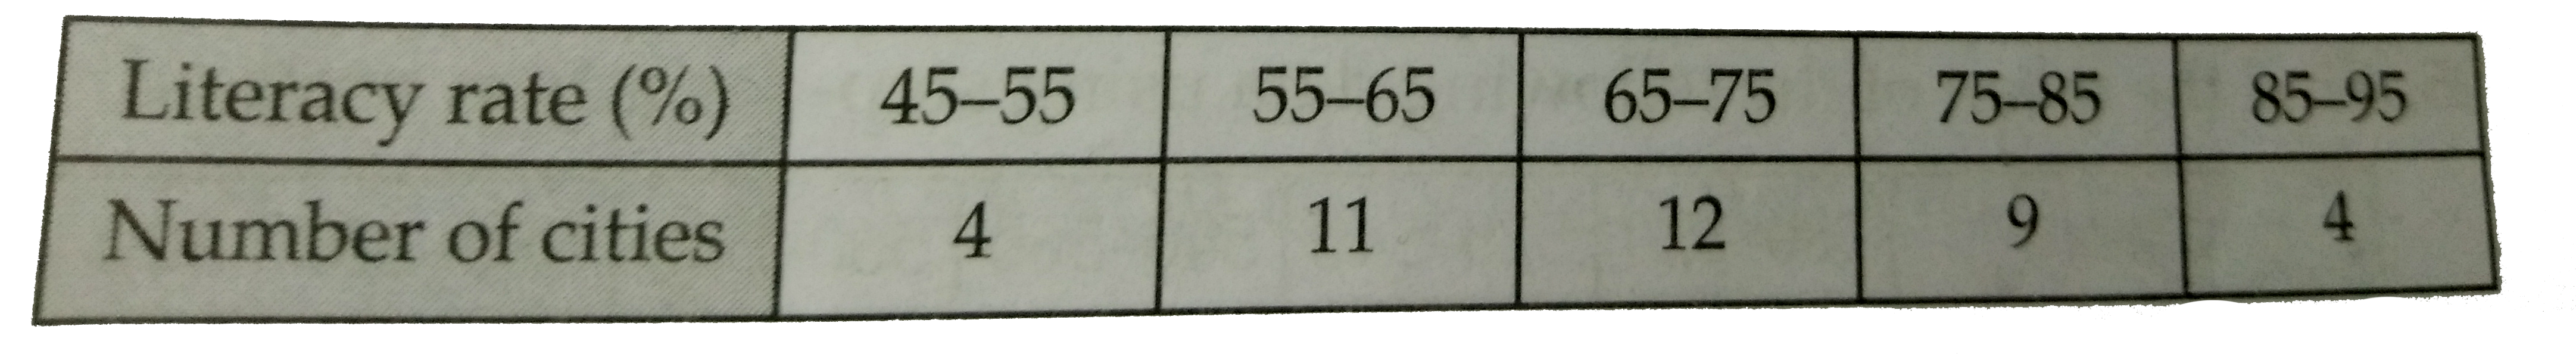
- The following table gives the literacy rate (in percentage ) in 40 cit...
Text Solution
|
- Find the mean of the following frequency distdribution using step- dev...
Text Solution
|
- Find the mean of following data, using step-deviation method :
Text Solution
|
- The weights of tea is 70 packets are shwon in the following tagble : ...
Text Solution
|
- Find the mean of the following frequency distribution using a suitable...
Text Solution
|
- In an annual examination marks (out of 90) obtained by students of Cla...
Text Solution
|
- Find the arithmetic mean of the following frequency distribution using...
Text Solution
|
- Find the mean of the following data using step-devition method :
Text Solution
|
- Find the avg age from the following frequency distribution :
Text Solution
|
- The following table shows the age distribution of paitents of malaria ...
Text Solution
|