Text Solution
Verified by Experts
The correct Answer is:


Topper's Solved these Questions
MEAN,MEDAN,MODE OF GROUPED,DATA CUMULATIVE FREQUENCY GRAPH AND OGIVE
RS AGGARWAL|Exercise EXERCISE 18 F|13 VideosMEAN,MEDAN,MODE OF GROUPED,DATA CUMULATIVE FREQUENCY GRAPH AND OGIVE
RS AGGARWAL|Exercise Exercise 18F|9 VideosMEAN,MEDAN,MODE OF GROUPED,DATA CUMULATIVE FREQUENCY GRAPH AND OGIVE
RS AGGARWAL|Exercise EXERCISE 18 D|3 VideosLINEAR EQUATIONS IN TWO VARIABLES
RS AGGARWAL|Exercise QUESTION|2 VideosPERIMETER AND AREA OF PLANE FIGURES
RS AGGARWAL|Exercise TEST YOURSELF (SHORT -ANSWER QUESTIONS)|1 Videos
Similar Questions
Explore conceptually related problems
RS AGGARWAL-MEAN,MEDAN,MODE OF GROUPED,DATA CUMULATIVE FREQUENCY GRAPH AND OGIVE -EXERCISE 18 E
- Find the median of the following data by making a ' less than ogive '
Text Solution
|
- The given distribution shows the numbers of wickets taken by the bowle...
Text Solution
|
- Draw a ' more than ' ogive for the data given below which give the ma...
Text Solution
|
- The hights of 50 girls of Class X of a school are recorded as follows...
Text Solution
|
- The monthly consumption of electricity (in units ) of some families of...
Text Solution
|
- The following table gives the production yeild per hectare of wheat o...
Text Solution
|
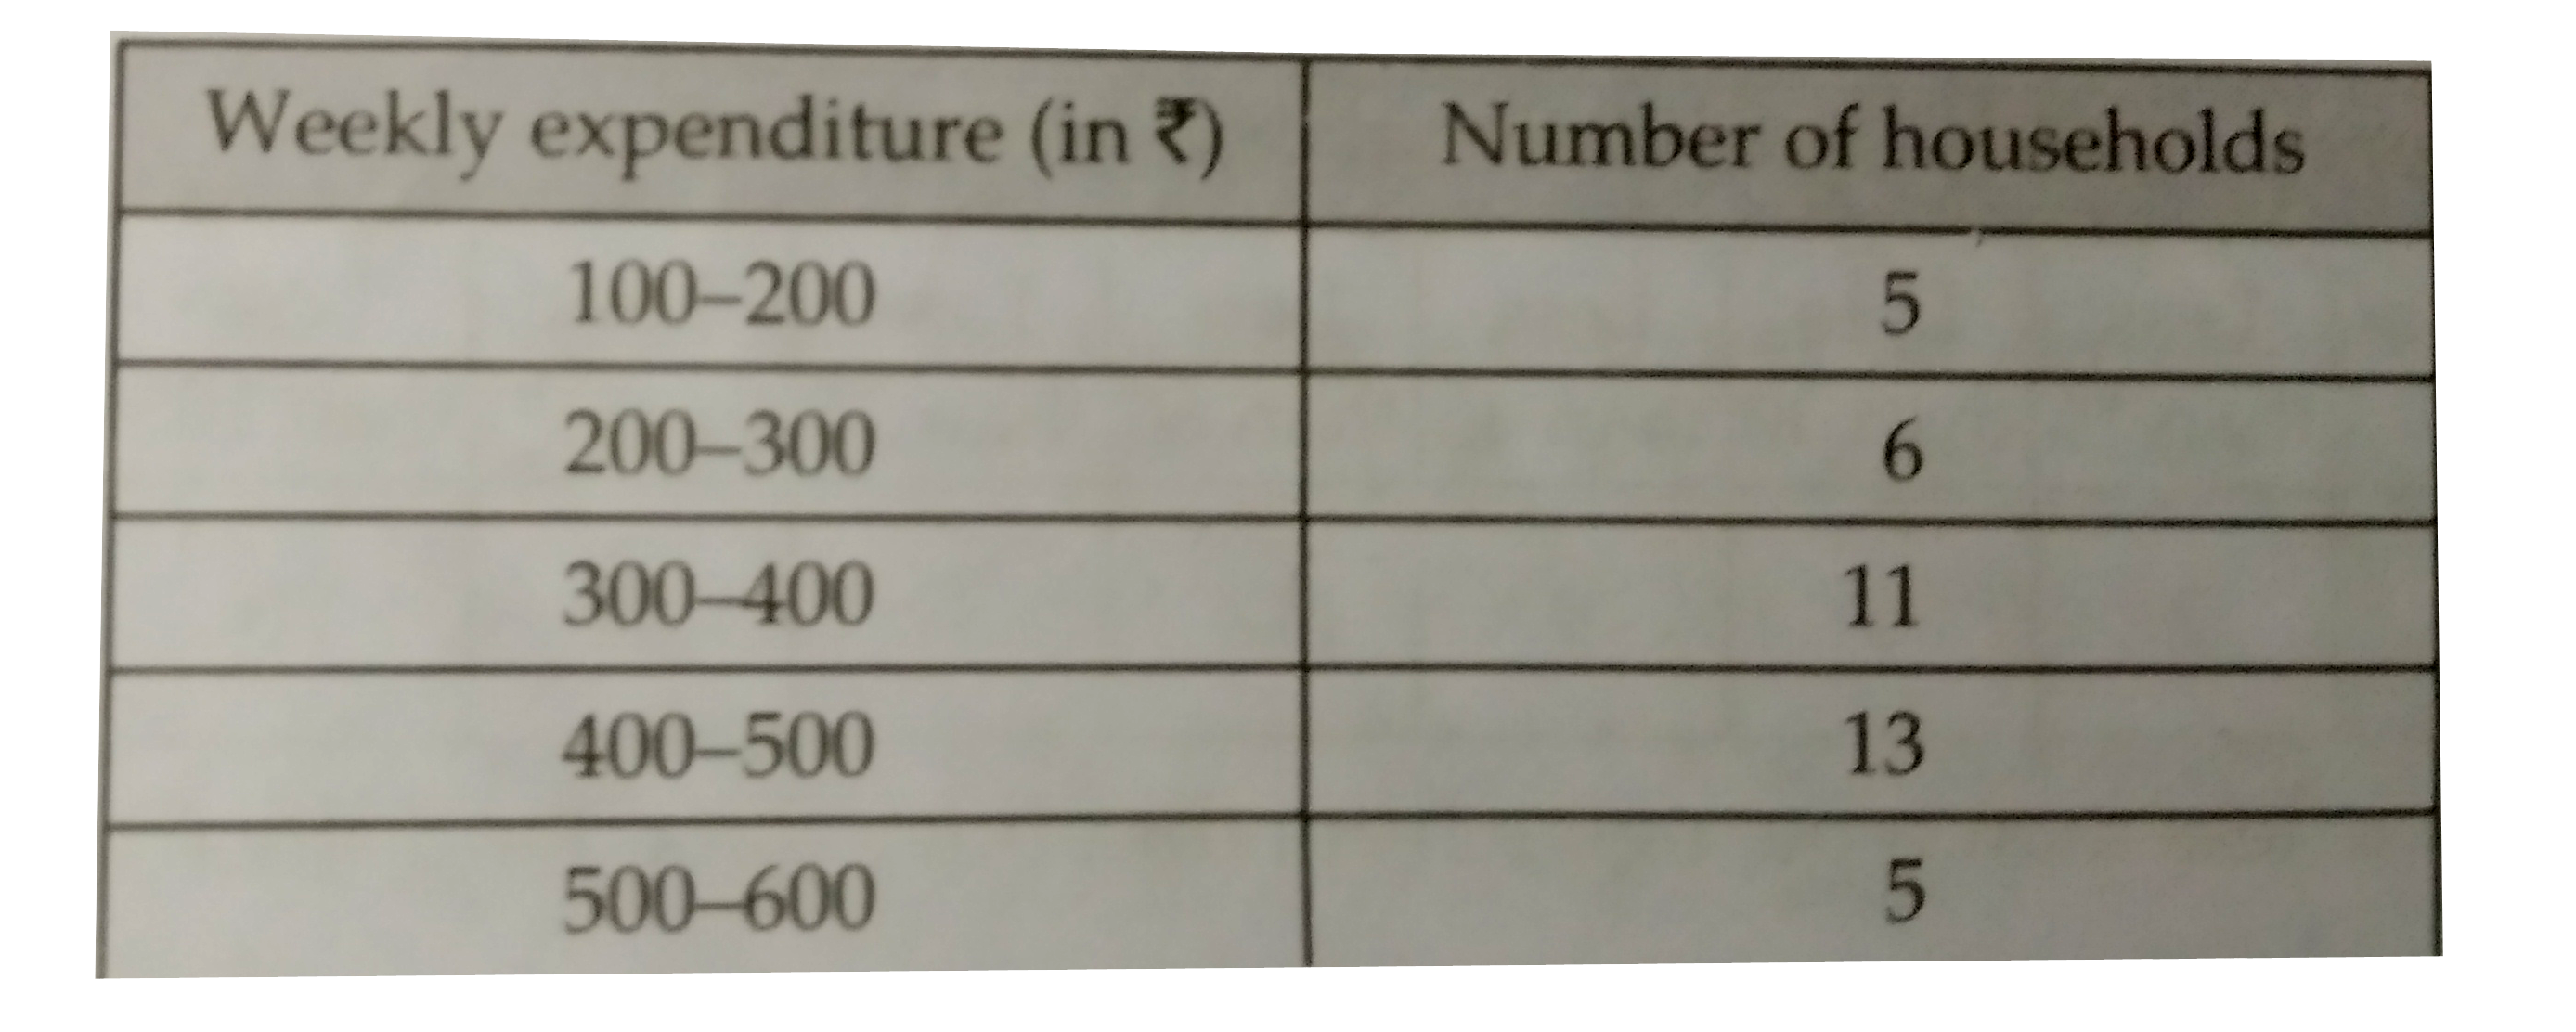
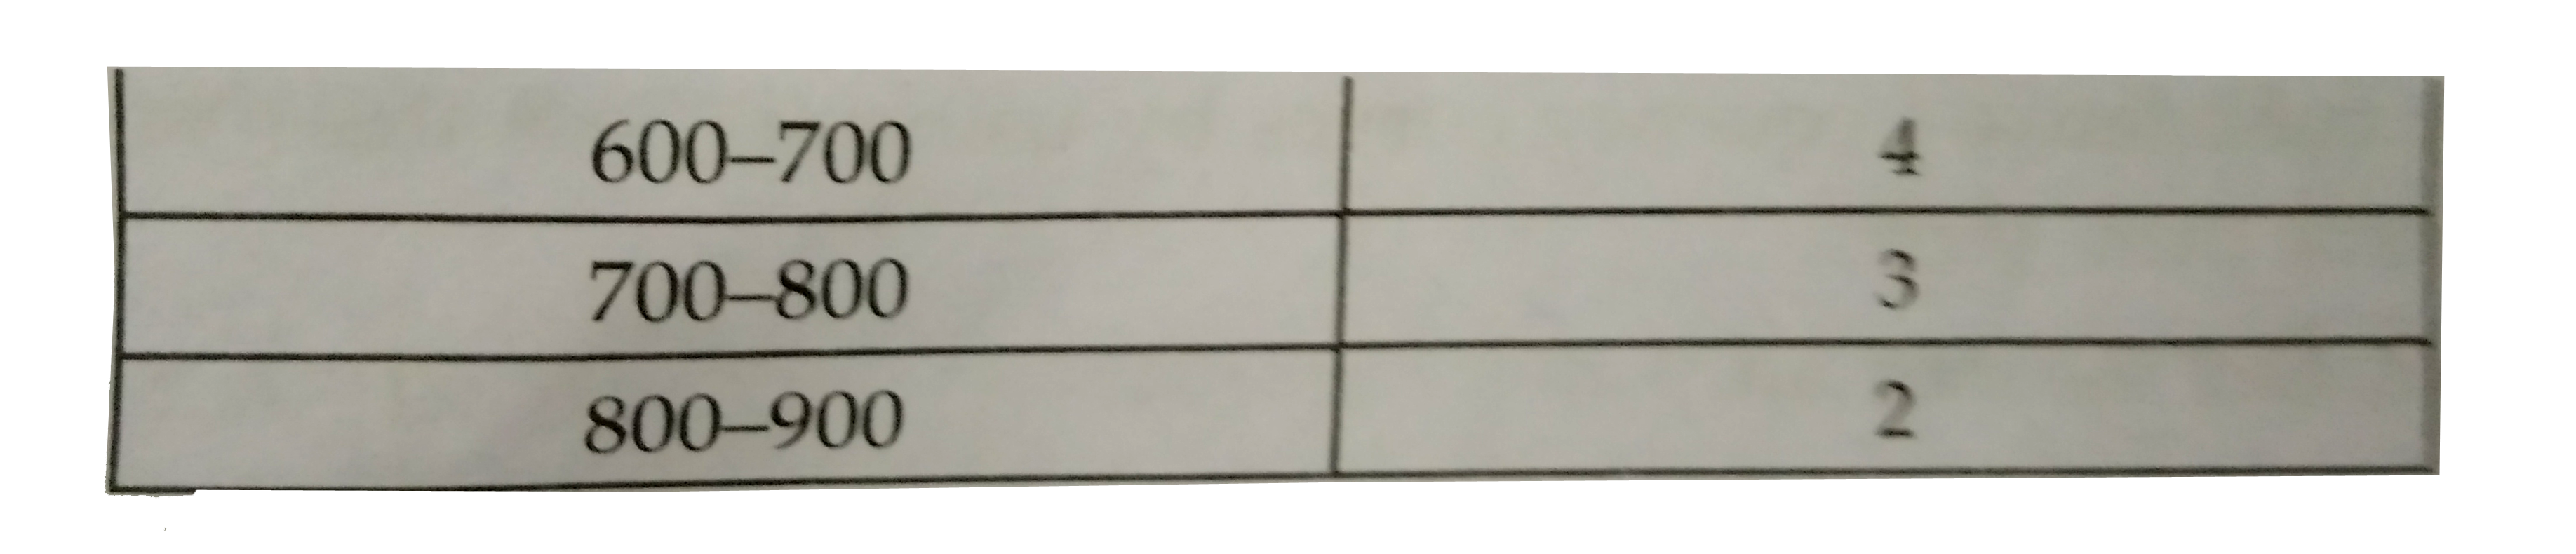
- The table given below shows the weekly expenditures on food of some ho...
Text Solution
|
- From the following frequency distribution , prepare the 'more than ' o...
Text Solution
|
- The marks obtained by 100 students of a class in an examnitation are g...
Text Solution
|
- From the following data , draw the two types of cumulative frequency c...
Text Solution
|