


Similar Questions
Explore conceptually related problems
Recommended Questions
- The equation of graph shown in figure is y=2x^(2). The slope of graph ...
Text Solution
|
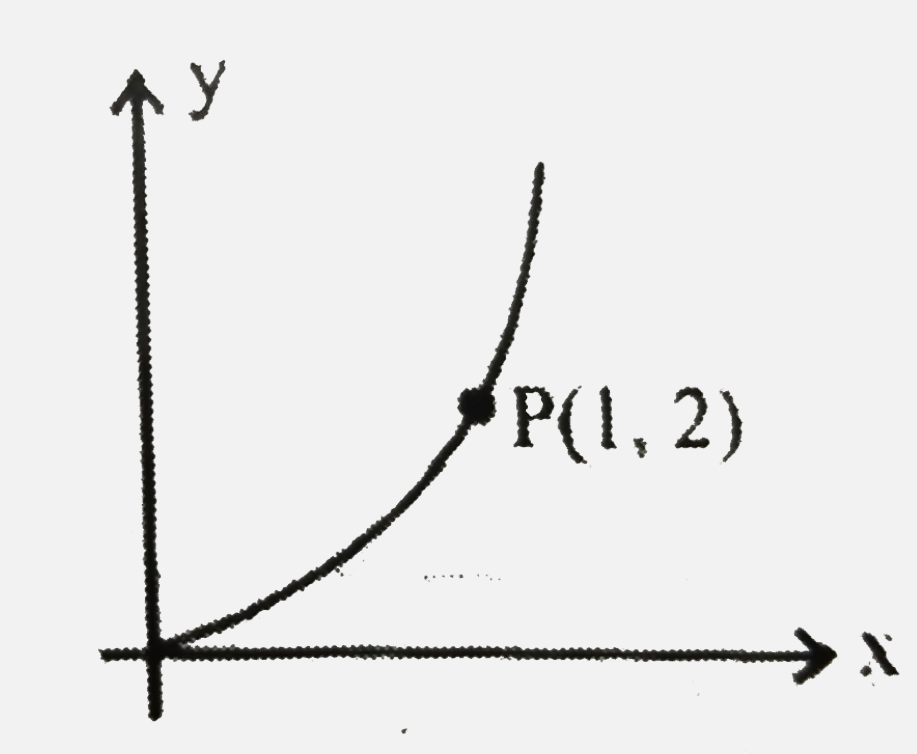
- The graph shown in figure is exponential. Write down the equation corr...
Text Solution
|
- For the shown graph slope of graph from point A to point B :
Text Solution
|
- The |u|,|v| graph for a concave mirror is a shown in figure. Here |u|g...
Text Solution
|
- The slope of graph as shown in figure at points 1,2 and 3 is m(1), m(2...
Text Solution
|
- Magnitude of slope of the shown graph.
Text Solution
|
- The slope of graph as shown in figure at points 1, 2 and 3 is m1, m2 a...
Text Solution
|
- The equation of graph shown in figure is y=2x^(2). The slope of graph ...
Text Solution
|
- The graph shown in figure is exponential. Write down the equation corr...
Text Solution
|