


Similar Questions
Explore conceptually related problems
Recommended Questions
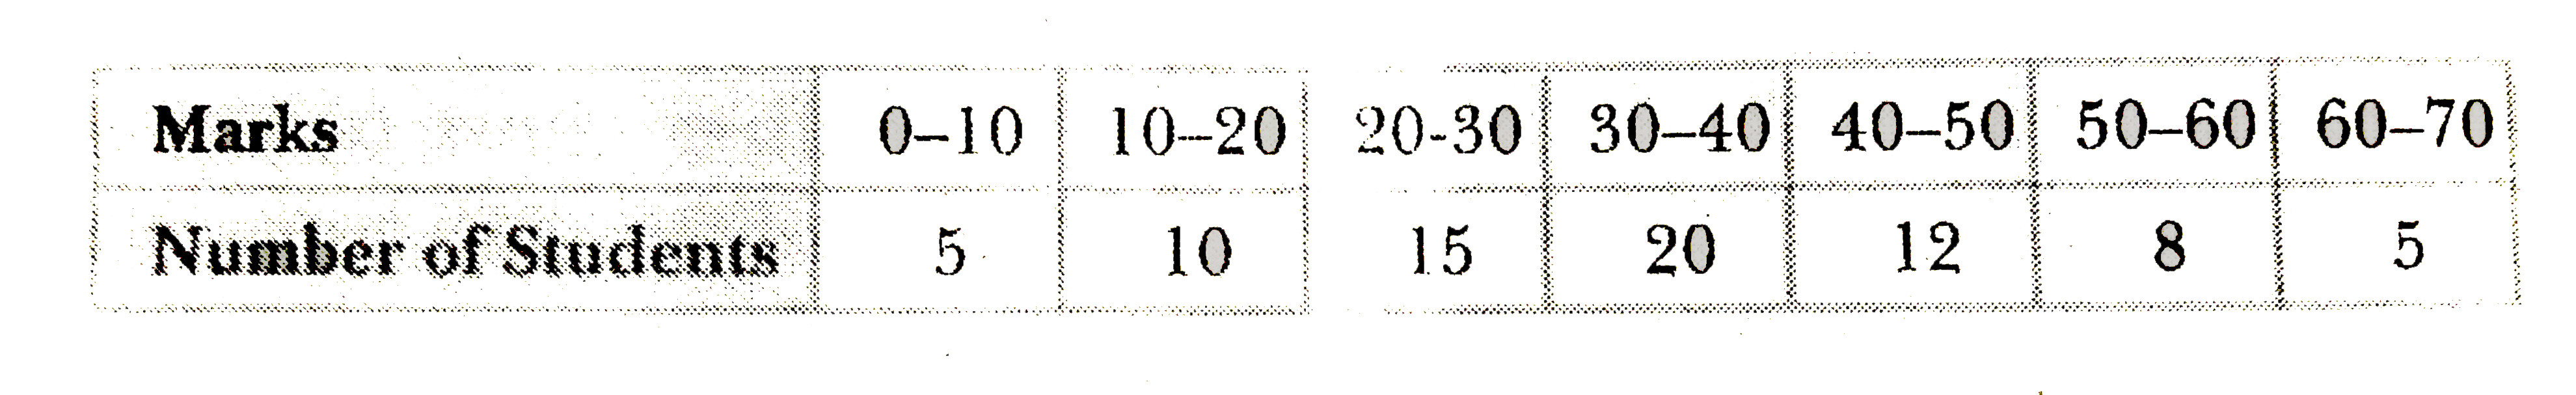
- Following table shows number of students of a college corresponding to...
Text Solution
|
- निम्नलिखित अभिक्रियाओं में योगिक [A] तथा [B] को पहचानिए तथा सम्बंधित...
Text Solution
|
- संक्रमण तत्वों में 4d-श्रेणी का तत्व है -
Text Solution
|
- एक द्विघात बहुपद के अधिक-से-अधिक शून्यको की संख्या होगी -
Text Solution
|
- 25 Omega प्रतिरोध का का धारामापी 10 mA की धारा के लिए पूर्ण स्केल विक...
Text Solution
|
- अनुनादी आवृत्ति किसे कहते हैं ?
Text Solution
|
- A .C स्त्रोत की आवृत्ति में परिवर्तन के साथ संधारित्र प्रतिघात ...
Text Solution
|
- एक कक्षा के छात्रों को पंक्ति में खड़ा किया जाता है। यदि प्रत्येक पंक्...
Text Solution
|
- तीन अका की एक संख्या के अंकों का योग 17 है। मध्य का अंक शेष दो अंकों क...
Text Solution
|