


Similar Questions
Explore conceptually related problems
Recommended Questions
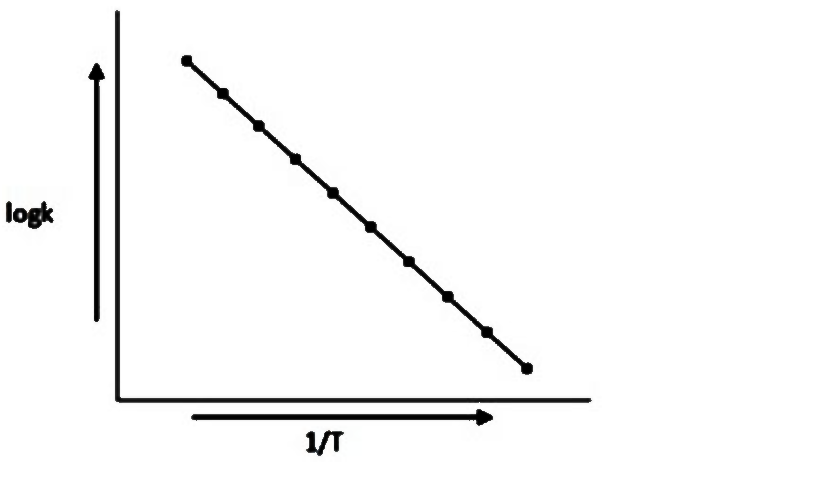
- When a plot between logk and 1/T is plotted we get the graph as shown....
Text Solution
|
- The temperature dependence of the rate constant k is expressed as k = ...
Text Solution
|
- When a plot between logk and 1/T is plotted we get the graph as shown....
Text Solution
|
- In Arrehenius equation if a graph is plotted between logK and 1/T, the...
Text Solution
|
- The temperature dependence of the rate constant k is expressed as k = ...
Text Solution
|
- When a plot between logk and 1/T is plotted we get the graph as shown....
Text Solution
|
- What type of graph we get when plot a graph PV against P at constant t...
Text Solution
|
- If we plot the graph between log K and 1/T by Arrhenius Equation, the ...
Text Solution
|
- If we plot the graph between log K and 1/T by Arrhenius Equation, the ...
Text Solution
|