


Similar Questions
Explore conceptually related problems
Recommended Questions
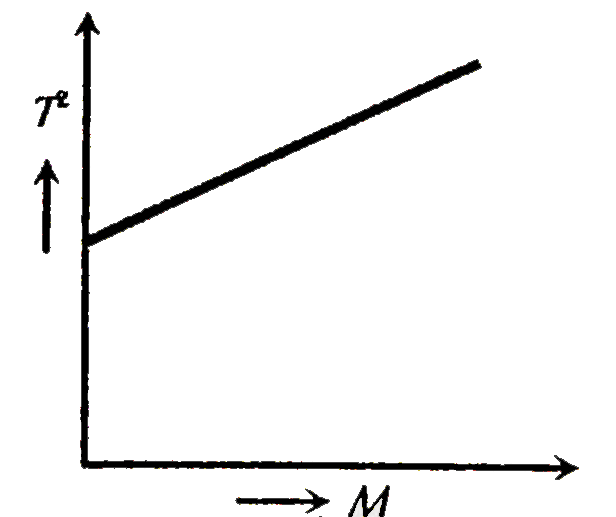
- The graph shown was obtained from experimental measurements of the per...
Text Solution
|
- A body of mass m is released from a height h to a scale pan hung from ...
Text Solution
|
- A body of mass m falls from a height h onto the pan of a spring balanc...
Text Solution
|
- The graph shown was obtained from experimental measurements of the per...
Text Solution
|
- The scale of a spring balance reading from 0 to 10 kg is 0.25 m long. ...
Text Solution
|
- The period of oscillation of a mass M suspended from a spring of sprin...
Text Solution
|
- The graph between period of oscillation (T) and mass attached (m) to a...
Text Solution
|
- द्रव्यमान रहित स्प्रिंग से लटकाये द्रव्यमान M का दोलनकाल T है। यदि इसक...
Text Solution
|
- The period of oscillation of a mass M suspended from a spring of negl...
Text Solution
|