Text Solution
Verified by Experts


Topper's Solved these Questions
MACHANICAL PROPERTIES OF SOLIDS
KUMAR PRAKASHAN|Exercise SECTION-A TRY YOURSELF (VSQs)|40 VideosMACHANICAL PROPERTIES OF SOLIDS
KUMAR PRAKASHAN|Exercise SECTION-B|45 VideosLAW OF MOTION
KUMAR PRAKASHAN|Exercise (QUESTION PAPER) SECTION-D|1 VideosMECHANICAL PROPERTIES OF FLUIDS
KUMAR PRAKASHAN|Exercise QUESTION PAPER (SECTION -C)|3 Videos
Similar Questions
Explore conceptually related problems
KUMAR PRAKASHAN-MACHANICAL PROPERTIES OF SOLIDS -QUESTION PAPER
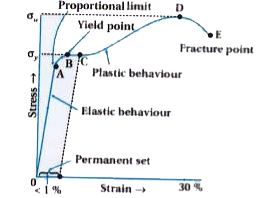
- Plot a stress to strain curve for a metal and explain.
Text Solution
|
- What is called brittle material ?
Text Solution
|
- Write Hooke's law.
Text Solution
|
- What is effect of tensile force on lateral dimensions ?
Text Solution
|
- What is buckling?
Text Solution
|
- What is compressibility ? Write its formula, unit and dimensional form...
Text Solution
|
- Why are the springs made of steel and not of copper ?
Text Solution
|
- Clarify the difference between stress and pressure.
Text Solution
|
- Derive an expression for elastic potential energy per unit volume stor...
Text Solution
|
- A rigid bar of mass 15 kg is supported symmetrically by three wires ea...
Text Solution
|
- What is the density of water at a depth where pressure is 80.0 atm, gi...
Text Solution
|
- Two strips of metal are riveted together at their ends by four rivets,...
Text Solution
|