Text Solution
Verified by Experts


Topper's Solved these Questions
MOTION IN A STRAIGHT LINE
KUMAR PRAKASHAN|Exercise SECTION-A TRY YOUR SELF (VSQs)|52 VideosMOTION IN A STRAIGHT LINE
KUMAR PRAKASHAN|Exercise SECTION-B|58 VideosMECHANICAL PROPERTIES OF FLUIDS
KUMAR PRAKASHAN|Exercise QUESTION PAPER (SECTION -C)|3 VideosOBJECTIVE QUESTIONS AS PER NEW PAPER STYLE
KUMAR PRAKASHAN|Exercise CHAPTER - 8 (Match Type questions)|5 Videos
Similar Questions
Explore conceptually related problems
KUMAR PRAKASHAN-MOTION IN A STRAIGHT LINE -QUESTION PAPER
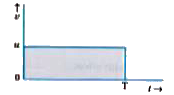
- Draw v to t graph for constant velocity and explain it.
Text Solution
|
- Define frame of reference and give its types.
Text Solution
|
- What is uniform motion ?
Text Solution
|
- Can the x tot graph of a moving object be parallel to the position ax...
Text Solution
|
- What is stopping distance for vehicle ?
Text Solution
|
- What will be the velocity and acceleration of ball upwards at maximum ...
Text Solution
|
- When the relative velocity of two cars v(A) = v(B) becomes zero ?
Text Solution
|
- The magnitude of displacement may or may not be equal to the path leng...
Text Solution
|
- For an object moving on a straight line, draw xtot graphs for : (i)...
Text Solution
|
- A police van moving on a highway with a speed of 30 kmh^(-1) fires a b...
Text Solution
|
- Two trains A and B of length 400 m each are moving on two parallel tra...
Text Solution
|
- Two towns A and B are connected by a regular bus service with a bus le...
Text Solution
|