A
B
C

D
Text Solution
Verified by Experts
The correct Answer is:


Topper's Solved these Questions
MOTION IN A STRAIGHT LINE
KUMAR PRAKASHAN|Exercise SECTION-E|71 VideosMOTION IN A STRAIGHT LINE
KUMAR PRAKASHAN|Exercise SECTION-F|20 VideosMOTION IN A STRAIGHT LINE
KUMAR PRAKASHAN|Exercise SECTION-C|43 VideosMECHANICAL PROPERTIES OF FLUIDS
KUMAR PRAKASHAN|Exercise QUESTION PAPER (SECTION -C)|3 VideosOBJECTIVE QUESTIONS AS PER NEW PAPER STYLE
KUMAR PRAKASHAN|Exercise CHAPTER - 8 (Match Type questions)|5 Videos
Similar Questions
Explore conceptually related problems
KUMAR PRAKASHAN-MOTION IN A STRAIGHT LINE -SECTION-D
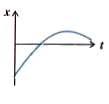
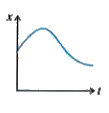
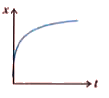
- Among the four graph shown in the figure there is only one graph for w...
Text Solution
|
- A lift is coming from 8th floor and it just a about to reach 4th flor....
Text Solution
|
- In one dimensional motion, instantaneous speed v satisfies 0 le v lt v...
Text Solution
|
- A person walking in a straight line, covers half of the distance to be...
Text Solution
|
- The displacement of a particle is given by x = (t-2)^(2) where x is i...
Text Solution
|
- At a metro station, a girl walks up a stationary escalator in time. t ...
Text Solution
|
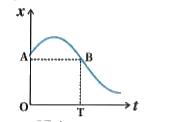
- The variation of quantity A with quantity B, plotted in figure. Descri...
Text Solution
|
- A graph of x versus t is shown in figure. Choose correct alternatives ...
Text Solution
|
- For the one-dimensional motion, described by x = t - sint
Text Solution
|
- A spring with one end attached to a mass and the other to a rigid supp...
Text Solution
|
- A ball is bouncing elastically with a speed 1 m/s between walls of a r...
Text Solution
|
- Refer to the graph in figure. Match the following
Text Solution
|
- A uniformly moving cricket ball is turned back by hitting it with a ba...
Text Solution
|
- Give examples of a one-dimensional motion where (a) The particle mov...
Text Solution
|
- Give example of a motion wherex gt 0 , v lt 0, a gt 0 at a particular...
Text Solution
|
- An object falling through a fluid is observed to have acceleration giv...
Text Solution
|
- As shown in fig. a metal ring is held horizontally and a bar magnet is...
Text Solution
|
- A particle executes the motion described by x(f) =x(0) (1- e ^(lamda t...
Text Solution
|
- A bird is tossing (flying to and fro) between two cars moving towards ...
Text Solution
|
- A man runs across the roof, top of a tall building and jumps horizonta...
Text Solution
|