


Similar Questions
Explore conceptually related problems
Recommended Questions
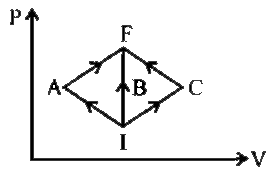
- In the P - V diagram, I is the initial state and F is the final state....
Text Solution
|
- An ideal gas undergoes isothermal process from some initial state i to...
Text Solution
|
- An ideal gas undergoes change in its state from the initial state I to...
Text Solution
|
- An idel gas undrgoes isothermal process from some initial state i to f...
Text Solution
|
- एक गैस की प्रारम्भिक व अन्तिम स्थतियाँ चित्र में i एवं f से प्रदर्शित ...
Text Solution
|
- एक गैस की प्रारम्भिक व अन्तिम स्थतियाँ चित्र में i एवं f से प्रदर्शित ...
Text Solution
|
- In the P - V diagram, I is the initial state and F is the final state....
Text Solution
|
- An ideal gas undergoes isothermal process from some initial state i to...
Text Solution
|
- Pv चित्र में I प्रारम्भिक स्थिति तथा F अन्तिम स्थिति है। गैस I से F की...
Text Solution
|