


Similar Questions
Explore conceptually related problems
Recommended Questions
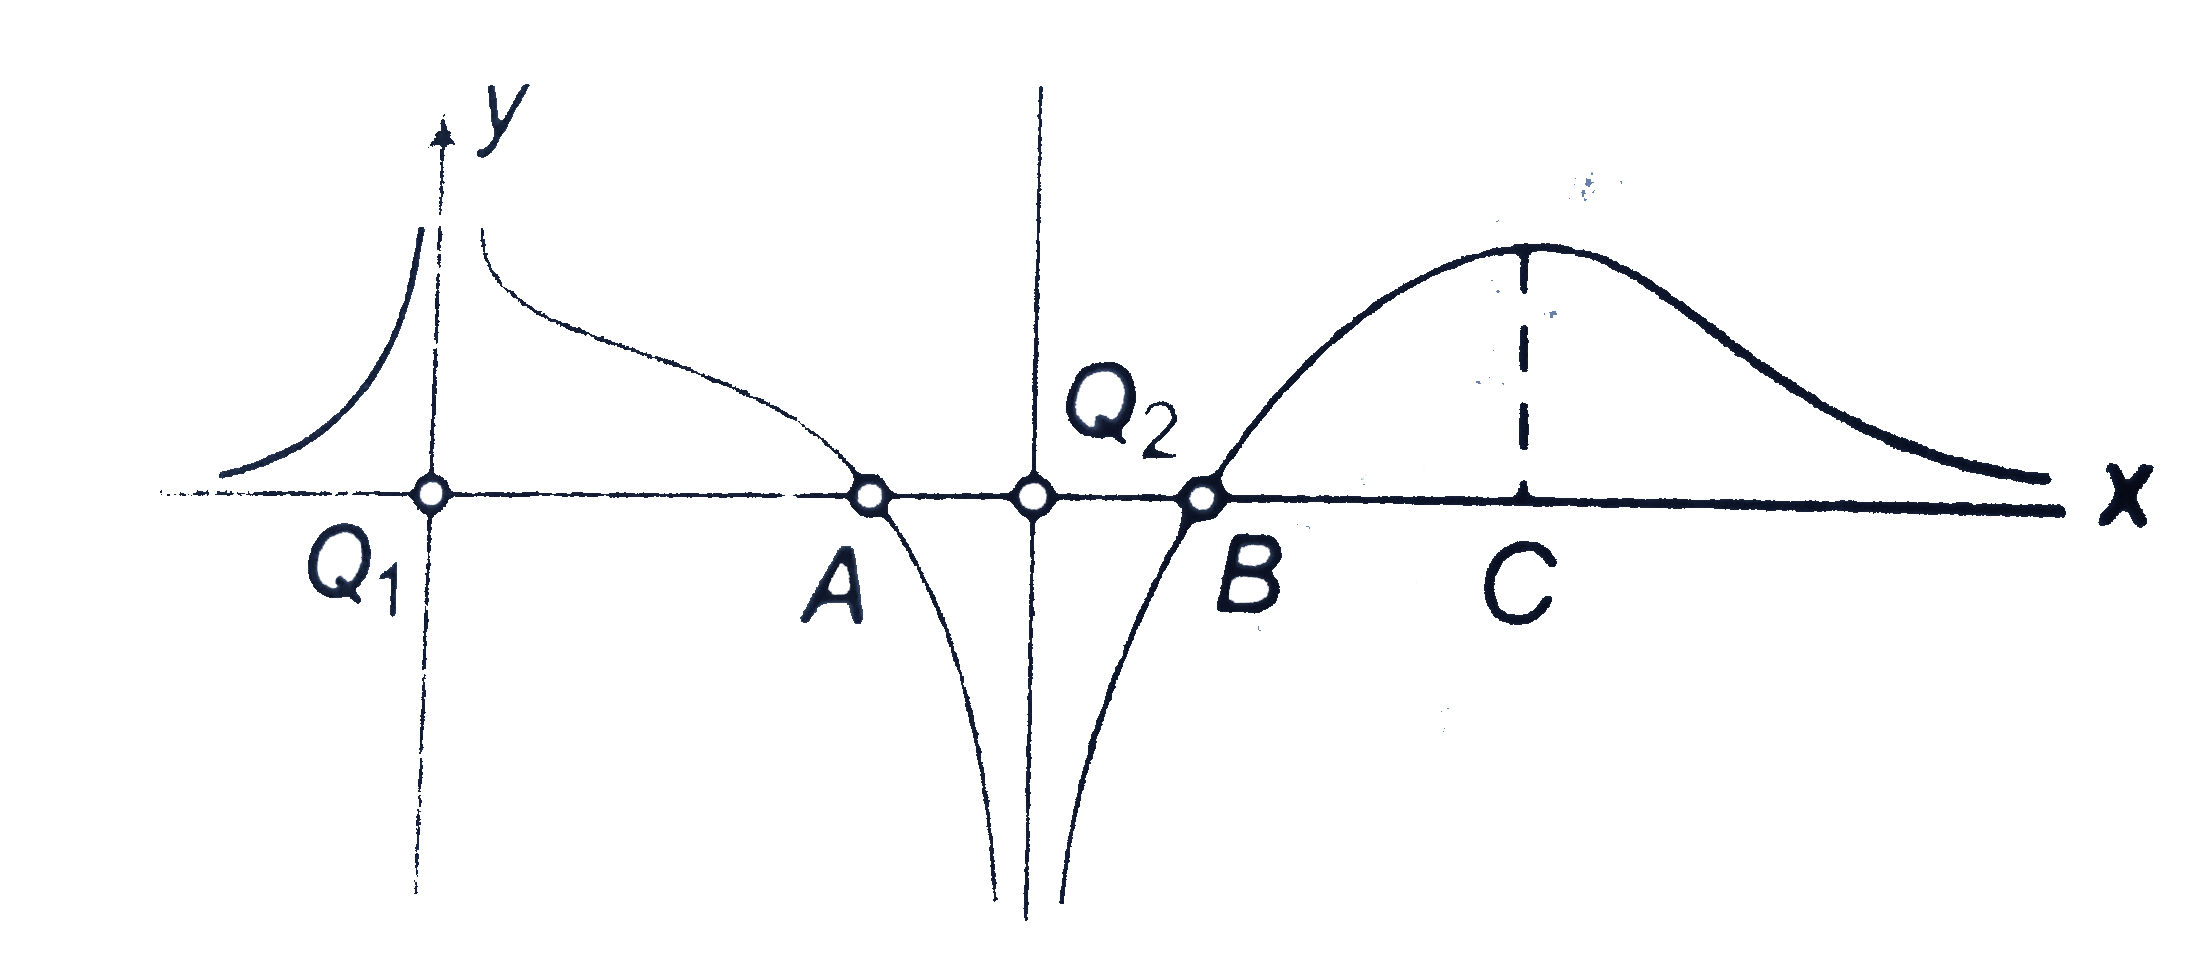
- The curve represents the distribution of potential along the staight l...
Text Solution
|
- Identify the correct statement about the charges q1 and q2 then
Text Solution
|
- The curve represents the distribution of potential along the staight l...
Text Solution
|
- The variation of electric field between two charge q1 and q2 along the...
Text Solution
|
- Two point charges Q1 and Q2 lie along a line at a distance from each o...
Text Solution
|
- Two point charges q1 and q2 are placed in an external uniform electric...
Text Solution
|
- एक बिन्दु आवेश q1=2 C , (2m , 1m) पर तथा एक आवेश q2 = -5C , (-2m , 4m...
Text Solution
|
- दो बिन्दु आवेशों q1 तथा q2 के लिए q1q2 gt 0 है । दोनों आवेशों के मध्य ...
Text Solution
|
- Two point charges q1 and q2 are fixed at a separation of 20 cm. Locate...
Text Solution
|