Home
Class 14
MATHS
निर्देश :- निम्नलिखित ग्राफ में एक फैक्ट...

निर्देश :- निम्नलिखित ग्राफ में एक फैक्ट्री द्वारा वर्ष तक वाहन के दो प्रकार (एवं )के उत्पादन को (हज़ार में ) दर्शाया गया है ग्राफ का अध्ययन कीजिये और नीचे दिए गए पांच प्रश्नो का उत्तर दीजिये :

वर्ष 2010 से 2011 तक टाइप Q वाहनों के उत्पादन में लगभग कितने प्रतिशत कमी आई ?

Promotional Banner

Similar Questions

Explore conceptually related problems

The distribution of fruit consumption in a sample of 73 seventeen-year-old girls is given in the graph below. Study the graph and answer the questions : What percent of these girls ate six or more servings per day? निम्नलिखित ग्राफ में 72 सत्रह - वर्षीय लड़कियों के सैम्पल में फलों की खपत (उपभोग) के विवरण को दर्शाया गया है। ग्राफ का अध्ययन कीजिए और प्रश्नों के आधार पर उत्तर दीजिए: प्रति दिन छह या अधिक आपूर्ति किए गए फलों को खाने वाली इन लड़कियों का प्रतिशत क्या था?

The distribution of fruit consumption in a sample of 73 seventeen-year-old girls is given in the graph below. Study the graph and answer the questions : How many of these girls ate more than two servings but less than six servings per day? निम्नलिखित ग्राफ में 72 सत्रह - वर्षीय लड़कियों के सैम्पल में फलों की खपत (उपभोग) के विवरण को दर्शाया गया है। ग्राफ का अध्ययन कीजिए और प्रश्नों के आधार पर उत्तर दीजिए: इनमें से कितनों लड़कियों ने प्रति दिन दो से अधिक किन्तु छह से कम आपूर्ति किए गए फलों को खाया?

The distribution of fruit consumption in a sample of 73 seventeen-year-old girls is given in the graph below. Study the graph and answer the questions : How many of these girls ate fewer than two servings per day? निम्नलिखित ग्राफ में 72 सत्रह - वर्षीय लड़कियों के सैम्पल में फलों की खपत (उपभोग) के विवरण को दर्शाया गया है। ग्राफ का अध्ययन कीजिए और प्रश्नों के आधार पर उत्तर दीजिए: इनमें से कितनी लड़कियों ने प्रति दिन दो से कम आपूर्ति किए गए फलों को खाया?

The following line diagram represents the yearly sales figure of a company in the years 2001-2010. Examine the diagram and answer the question. निम्नलिखित रेखा आरेख किसी कंपनी की वर्ष 2007-2010 के दौरान वार्षिक बिक्री के आंकड़ों को दर्शाता है। आरेख का अध्ययन करें और नीचे दिए गए प्रश्नों के उत्तर दें- The ratio of sales in 2002 to that in 2007 is वर्ष 2002 में बिक्री का वर्ष 2007 में बिक्री के साथ अनुपात है-

Study the Bar diagram carefully and answer the question. The Bar diagram shows the trends of foreign direct investment (FDI) into India from all over the World Gin Rs. crores) The year which exhibited the 2nd highest growth percentage in FDI in India over the period shown is बार ग्राफ में समस्त विश्व से भारत में विदेशी प्रत्यक्ष निवेश (एफ डी आई) की प्रवृत्ति को दर्शाया गया है। बार ग्राफ का ध्यानपूर्वक अध्ययन कीजिए और प्रश्नों का उत्तर दीजिए। दर्शायी गयी अवधि में भारत में किस वर्ष सर्वाधिक विदेशी प्रत्यक्ष निवेश किया गया ?

The following line diagram represents the yearly sales figure of a company in the years 2001-2010. Examine the diagram and answer the question. निम्नलिखित रेखा आरेख किसी कंपनी की वर्ष 2007-2010 के दौरान वार्षिक बिक्री के आंकड़ों को दर्शाता है। आरेख का अध्ययन करें और नीचे दिए गए प्रश्नों के उत्तर दें- By what percent did the sales in 2008 decrease in comparison to the sales in 2006? वर्ष 2006 में बिक्री की तुलना में वर्ष 2008 में बिक्रो में कितने प्रतिशत की कमी आई?

The following line diagram represents the yearly sales figure of a company in the years 2001-2010. Examine the diagram and answer the question. निम्नलिखित रेखा आरेख किसी कंपनी की वर्ष 2007-2010 के दौरान वार्षिक बिक्री के आंकड़ों को दर्शाता है। आरेख का अध्ययन करें और नीचे दिए गए प्रश्नों के उत्तर दें- The percentage increase in sales in the year 2005 with respect to the previous year is वर्ष 2005 में पिछले वर्ष की तुलना में बिक्री में वृद्धि का प्रतिशत है-

Study the following graph which shows income and expenditure of a company over the years and answer the questions. The percentage increase in income of the company from 2007 to 2008 is. निम्नलिखित चार्ट का अध्ययन कीजिए जिसमें कंपनी की कुछ वर्षों की आय एवं उसके व्यय को दर्शाया गया है और प्रश्नों के उत्तर दीजिए : वर्ष 2007 से 2008 तक कंपनी की आय में वृद्धि का प्रतिशत कितना रहा?

Recommended Questions
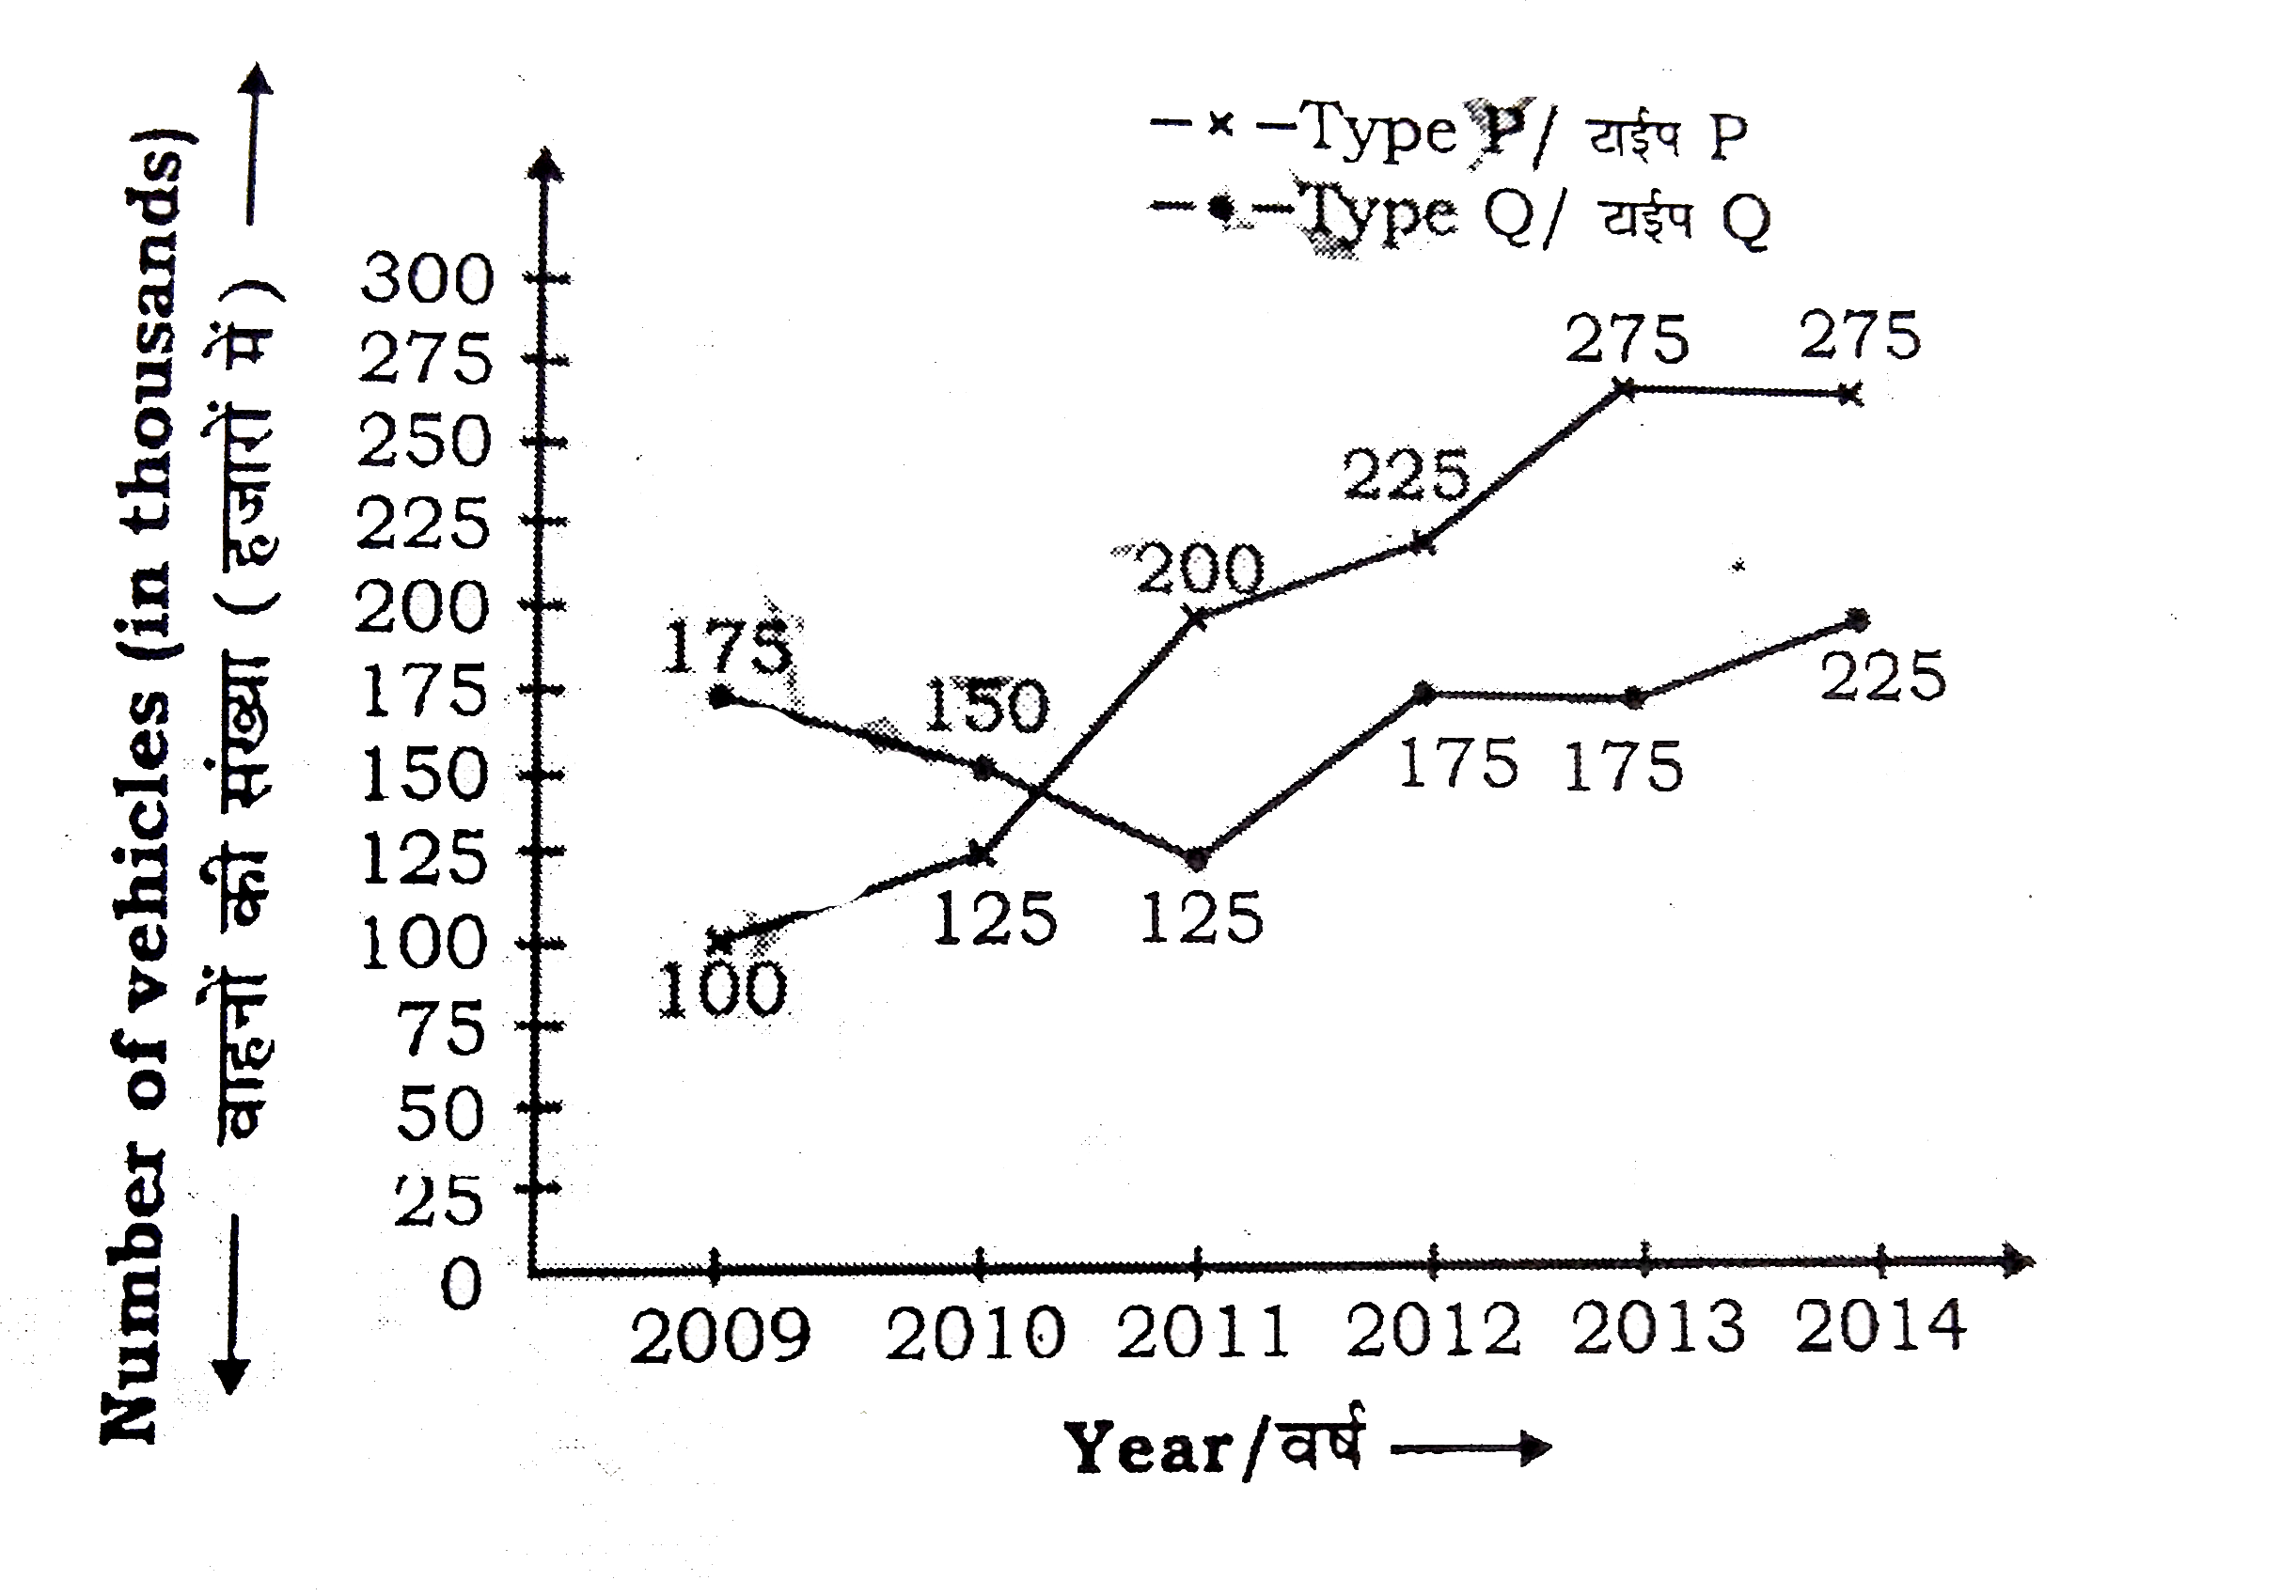
  1. निर्देश :- निम्नलिखित ग्राफ में एक फैक्ट्री द्वारा वर्ष तक वाहन के दो ...

    Text Solution

    |

  2. निचे दिये गये ग्राफ में दो प्रकार के वाहनों A व B के छ वर्षो के प्रद...

    Text Solution

    |

  3. निचे दिये गये ग्राफ में दो प्रकार के वाहनों A व B के छ वर्षो के प्रद...

    Text Solution

    |

  4. निचे दिये गये ग्राफ में दो प्रकार के वाहनों A व B के छ वर्षो के प्रद...

    Text Solution

    |

  5. निचे दिये गये ग्राफ में दो प्रकार के वाहनों A व B के छ वर्षो के प्रद...

    Text Solution

    |

  6. निचे दिये गये ग्राफ में दो प्रकार के वाहनों A व B के छ वर्षो के प्रद...

    Text Solution

    |

  7. निचे दिये गये ग्राफ में दो प्रकार के वाहनों A व B के छ वर्षो के प्रद...

    Text Solution

    |

  8. निचे दिये गये ग्राफ में दो प्रकार के वाहनों A व B के छ वर्षो के प्रद...

    Text Solution

    |

  9. निचे दिये गये ग्राफ में दो प्रकार के वाहनों A व B के छ वर्षो के प्रद...

    Text Solution

    |