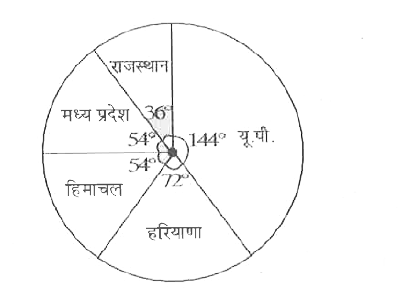
चित्र में दिया गया वृत्त चार्ट मई -जून 2013 के दौरान वाहनों का केन्द्र्य सर्कार द्वारा चल्या गये अभियान में कटे हुए चलानो की संख्या को डिग्री (""`^(@)` ) में दर्शाता है। इसे ध्यानपूर्वक पढ़िए व निम्न प्रशनो के उत्तर दीजिए।
हरयाणा में कटे चालानों की संख्या ज्ञात करो।
चित्र में दिया गया वृत्त चार्ट मई -जून 2013 के दौरान वाहनों का केन्द्र्य सर्कार द्वारा चल्या गये अभियान में कटे हुए चलानो की संख्या को डिग्री (""`^(@)` ) में दर्शाता है। इसे ध्यानपूर्वक पढ़िए व निम्न प्रशनो के उत्तर दीजिए।
हरयाणा में कटे चालानों की संख्या ज्ञात करो।
हरयाणा में कटे चालानों की संख्या ज्ञात करो।


Similar Questions
Explore conceptually related problems
The table given below shows the number of applicants who have applied for exam at various centres as percentage of total number of applicants. The table also shows the number online applicants and absent applicants as a percentage of total applicants of each centre. Total number of applicants is 1200000. नीचे दी गई तालिका में विभिन्न परीक्षा केन्द्रों में परीक्षा का नामांकन भरने वाले अभ्यर्थियों को संख्या को कुल अभ्यर्थियों की संख्या के प्रतिशत के रूप में दर्शाया गया है। यह तालिका प्रत्येक परीक्षा केन्द्र के ऑनलाइन अभ्यर्थियों तथा अनुपस्थित अभ्यर्थियों की संख्या को कुल अभ्यर्थियों की संख्या के प्रतिशत के रूप में दर्शाती है। अभ्यर्थियों की कुल संख्या 1200000 है। If A equals to 15% of total applicants who are present at exam centre F and B equals to present applicants at exam centre K, then A is what percent of B? यदि A परीक्षा केन्द्र F पर उपस्थित अभ्यर्थियों की कुल संख्या के 15% के बराबर है तथा B परीक्षा केन्द्र K पर उपस्थित अभ्यर्थियों के बराबर है, तो A, B का कितना प्रतिशत है?
The given Bar Graph presents the number of different types of vehicles exported by a company in 2017 and 2018.What is the ratio of the total number of vehicles exported in 2017 of types B, C and D to that of vehicles exported in 2018 of the types A, D and E? दिया गया दंड आरेख एक कंपनी के द्वारा 2017 और 2018 में निर्यात किये गए अलग-अलग प्रकार के वाहनों की संख्या को दर्शाता है | 2017 में निर्यात किये गए B, C और D प्रकार के वाहनों की कुल संख्या का 2018 में निर्यात किये गए A, D और E प्रकार के वाहनों की संख्या के साथ अनुपात ज्ञात करें |
The given bar graph represents the number of students who appeared in the board examination in session 2017-18 and 2018-19. Study the graph and answer the question that follows. What is the ratio of the total number of students appeared in examinations in 2017-18 and 2018-19? दिया गया दंड आरेख सत्र 2017-18 और 2018-19 सत्र में बोर्ड परीक्षा में उपस्थित होने वाले छात्रों की संख्या को दर्शाता है। आरेख का अध्ययन करें और प्रश्न का उत्तर दें। 2017-18 और 2018-19 में परीक्षा में उपस्थित हुए छात्रों की कुल संख्या का अनुपात कया है ?
The given Bar Graph presents different types of vehicles (in lakhs) exported by a company in 2016 and 2017. The average number of all types of vehicles exported by the company in 2016 is what percent less than the number of type B vehicles exported in 2017? दिया गया दंड आरेखा (बार ग्राफ) 2016 और 2017 में किसी कंपनी द्वारा निर्यात किए गए विभिन्न प्रकार के वाहनों (लाखों में) को दर्शाता है| 2016 में कंपनी दवारा निर्यात किए गए सभी प्रकार के वाहनों की औसत संख्या, 2017 में निर्यात किए गए टाइप B वाहनों की संख्या से कितने प्रतिशत कम है?
The given table represents the number of engineers recruited by four companies A,B,C and D over the years. Study the table carefully and answer the questions that follows: The ratio of the total number of engineers recruited by companies A and B in 2015 and 2018 to the total number of engineers recruited by C and D in 2014 and 2018 is: दी गयी तालिका चार कंपनियों A, B, C और D के द्वारा इन वर्षों के दौरान भर्ती किये गए इंजीनियरों की संख्या दर्शाती है | इस तालिका का ध्यानपूर्वक अध्ययन करें तथा इसके बाद पूछे गए प्रश्न का उत्तर दें | कंपनी A और B के द्वारा 2015 और 2018 में भर्ती किये गए इंजीनियरों की कुल संख्या एवं C तथा D के द्वारा 2014 और 2018 में भर्ती किये गए इंजीनियरों की कुल संख्या के बीच अनुपात ज्ञात करें |
The given Bar Graph presents the number of students enrolled for vocational course institutes A and B during a period of 5 years. In which year the number of students enrolled in B is x% more, where 25 lt x lt 30 , then the number of students enrolled in A in the same year? दिया गया दंड आरेख (बार ग्राफ) 5 वर्ष की अवधि के दौरान संस्थान A और B में व्यावसायिक पाठ्यक्रम के लिए नामांकित विद्यार्थियों की संख्या को दर्शाता है| किस वर्ष में संस्थान B में नामांकित विद्यार्थियों की संख्या उसी वर्ष संस्थान A में नामांकित विद्यार्थियों की संख्या से x % अधिक है, जहां 25 lt x lt 30 है?
The given table represents the number of engineers recruited by four companies A,B,C and D over the years. Study the table carefully and answer the questions that follows:The total number of engineers recruited by company A in 2014 to 2017 is what percentage more than the total number of engineers recruited by all the four companies in 2019? दी गयी तालिका चार कंपनियों A, B, C और D के द्वारा इन वर्षों के दौरान भर्ती किये गए इंजीनियरों की संख्या दर्शाती है | इस तालिका का ध्यानपूर्वक अध्ययन करें तथा इसके बाद पूछे गए प्रश्न का उत्तर दें | कंपनी A के द्वारा 2014 से 2017 की अवधि में भर्ती किये गए इंजीनियरों की कुल संख्या सभी चार कंपनियों के द्वारा 2019 में भर्ती किये गए इंजीनियरों की कुल संख्या से कितना प्रतिशत अधिक है ?
The following graph shows the number of books sold by a book-seller during five-months of 2019, April, May, June, July and August. Study the graph and answer the questions: निम्नलिखित आरेख, 2019 के अप्रैल, मई, जून, जुलाई और अगस्त के पांच महीनों के दौरान एक पुस्तक-विक्रेता द्वारा बेची गई पुस्तकों की संख्या को दर्शाता है। आरेख का अध्ययन करें और प्रश्नों के उत्तर दें: The total number of books sold during these five month is: इन पाँच महीनों के दौरान बेची गई पुस्तकों की कुल संख्या है:
The given Bar Graph presents different types of vehicles (in lakhs) exported by a company in 2016 and 2017.What is the ratio of the total number of vehicles of type D and E exported by the company in 2016 to that of vehicles of type C and E exported in 2017? दिया गया दंड आरेख (बार ग्राफ) 2016 और 2017 में किसी कंपनी द्वारा निर्यात किए गए विभिन्न प्रकार के वाहनों (लाखों में) को दर्शाता है| 2016 में कंपनी द्वारा निर्यात किए जाने वाले D और E टाइप के वाहनों की कुल संख्या और 2017 में निर्यात किए गए C और E टाइप के वाहनों का अनुपात क्या है?
The pie-chart given below shows the number of laptops in an office provided by six different companies in the percentage of total number of laptops. The central angles given in the pie chart are not accurate to any scale. नीचे दिया गया वृत्त-आरेख, छह अलग-अलग कम्पनियों द्वारा किसी कार्यालय में प्रदत्त लैपटॉप की संख्या को, लेपटॉपों की कुल संख्या के प्रतिशत के रूप में दर्शाता है | वृत्त-आरेख में प्रदर्शित केंद्रीय कोण किसी चयनित पैमाने के अनुसार नहीं है | If the total number of laptops in office is 3800, then find the difference between the laptops of company C2 and C5 ? कार्यालय में यदि लैपटॉपों की कुल संख्या 3800 है तो कंपनी C2 तथा C5 के लैपटॉपों की संख्या में अंतर कितना है ?
Recommended Questions
- चित्र में दिया गया वृत्त चार्ट मई -जून 2013 के दौरान वाहनों का केन्...
Text Solution
|
- दिये गये चित्र में स्पर्श रेखाओ की संख्या है -
Text Solution
|
- निचे दिये गये ग्राफ में दो प्रकार के वाहनों A व B के छ वर्षो के प्रद...
Text Solution
|
- निचे दिये गये ग्राफ में दो प्रकार के वाहनों A व B के छ वर्षो के प्रद...
Text Solution
|
- निचे दिये गये ग्राफ में दो प्रकार के वाहनों A व B के छ वर्षो के प्रद...
Text Solution
|
- निचे दिये गये ग्राफ में दो प्रकार के वाहनों A व B के छ वर्षो के प्रद...
Text Solution
|
- चित्र में दिया गया वृत्त चार्ट मई -जून 2013 के दौरान वाहनों का केन्...
Text Solution
|
- चित्र में दिया गया वृत्त चार्ट मई -जून 2013 के दौरान वाहनों का केन्...
Text Solution
|
- निम्न वृत्त -चित्र एक अभ्यर्थी द्वारा प्रदूषण जांच अभियान के द्वारा वि...
Text Solution
|