A
B
C
D
Text Solution
Verified by Experts
The correct Answer is:


Topper's Solved these Questions
ORGANISMS AND POPULATIONS
AAKASH INSTITUTE|Exercise ASSIGNMENT (SECTION-D) (Assertion-Reason Type Questions)|15 VideosORGANISMS AND POPULATIONS
AAKASH INSTITUTE|Exercise ASSIGNMENT (SECTION-B) (Objective Type Questions)|35 VideosNEURAL CONTROL AND COORDINATION
AAKASH INSTITUTE|Exercise Assignment SECTION - D (Assertion-Reason Type Questions )|10 VideosPHOTOSYNTHESIS IN HIGHER PLANTS
AAKASH INSTITUTE|Exercise Assignment(section D)|10 Videos
Similar Questions
Explore conceptually related problems
AAKASH INSTITUTE-ORGANISMS AND POPULATIONS -ASSIGNMENT (SECTION-C) (Previous Years Questions)
- Roots play insignificant role in absorption of water in
Text Solution
|
- In which of the following interaction both partners are adversely affe...
Text Solution
|
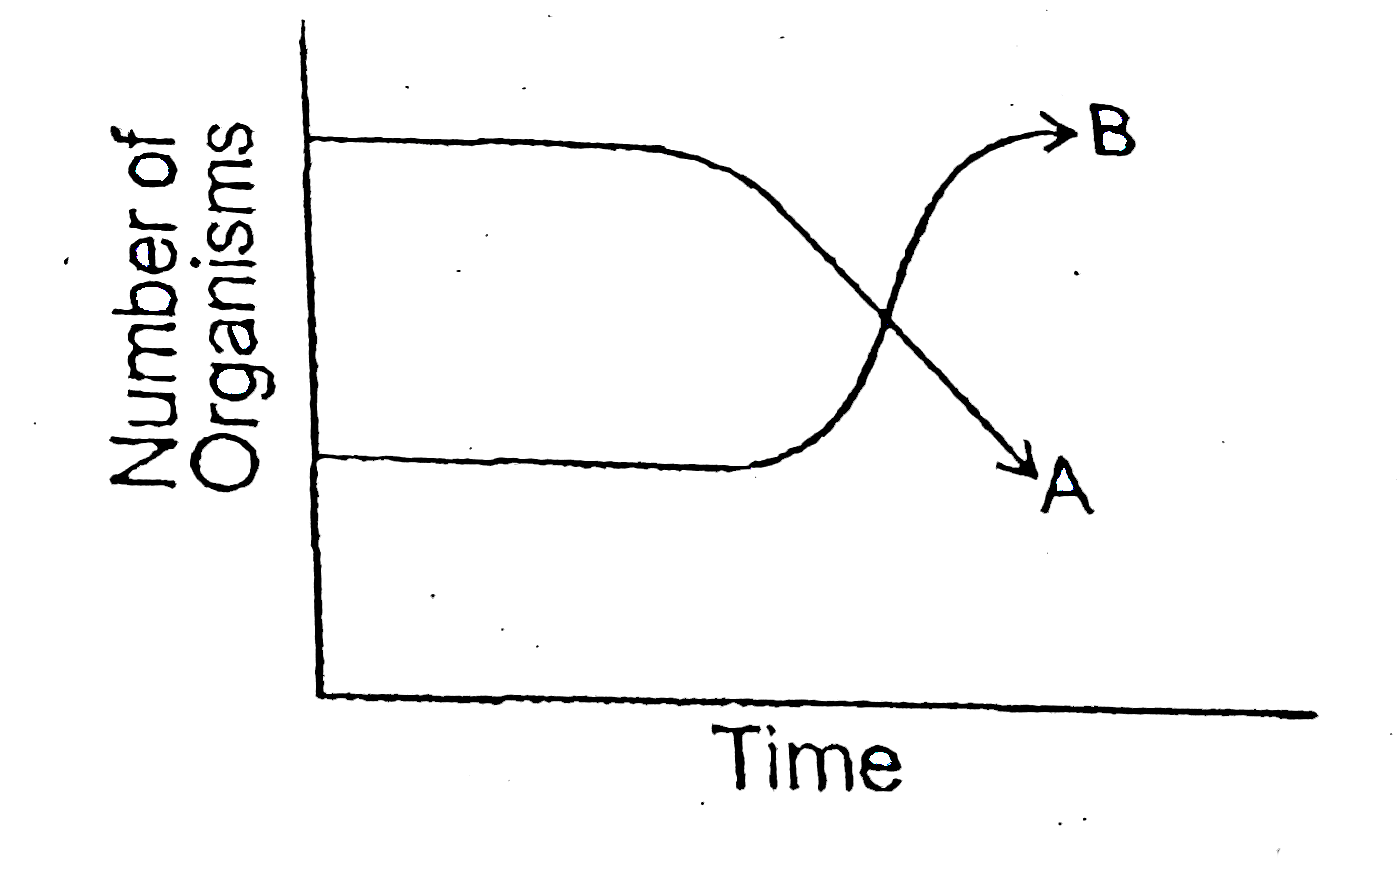
- The following graph depicts changes in two populations (A and B) of he...
Text Solution
|
- Most animals are tree dwellers in a :
Text Solution
|
- Just as a person moving from Delhi to Shimla to escape the heat for th...
Text Solution
|
- A sedentary sea anemone gets attached to the shell lining of hermit cr...
Text Solution
|
- A biologist studied the population of rats in a barn. He found that th...
Text Solution
|
- Cuscuta is an example of
Text Solution
|
- People who have migrated from the planes to an area adjoining Rohtang ...
Text Solution
|
- The logistic population growth is expressed by the equation
Text Solution
|
- Large woody vines are more commonly found in
Text Solution
|
- Which one of the following is categorised as a parasite in true sense
Text Solution
|
- Considered the following four conditions (A-D) and select the correct ...
Text Solution
|
- What type of human population represented by the following age pyrami...
Text Solution
|
- The figure given below is a diagrammatic representation of response of...
Text Solution
|
- Which one of the following is most appropriately defined?
Text Solution
|
- Which one of the following is one of the characteristics of a biologic...
Text Solution
|
- Study the four statement (i-iv) given below and select the two correct...
Text Solution
|
- What is true about the isolated small tribal populations ?
Text Solution
|
- Quercus species is the dominant component in
Text Solution
|