


Similar Questions
Explore conceptually related problems
Recommended Questions
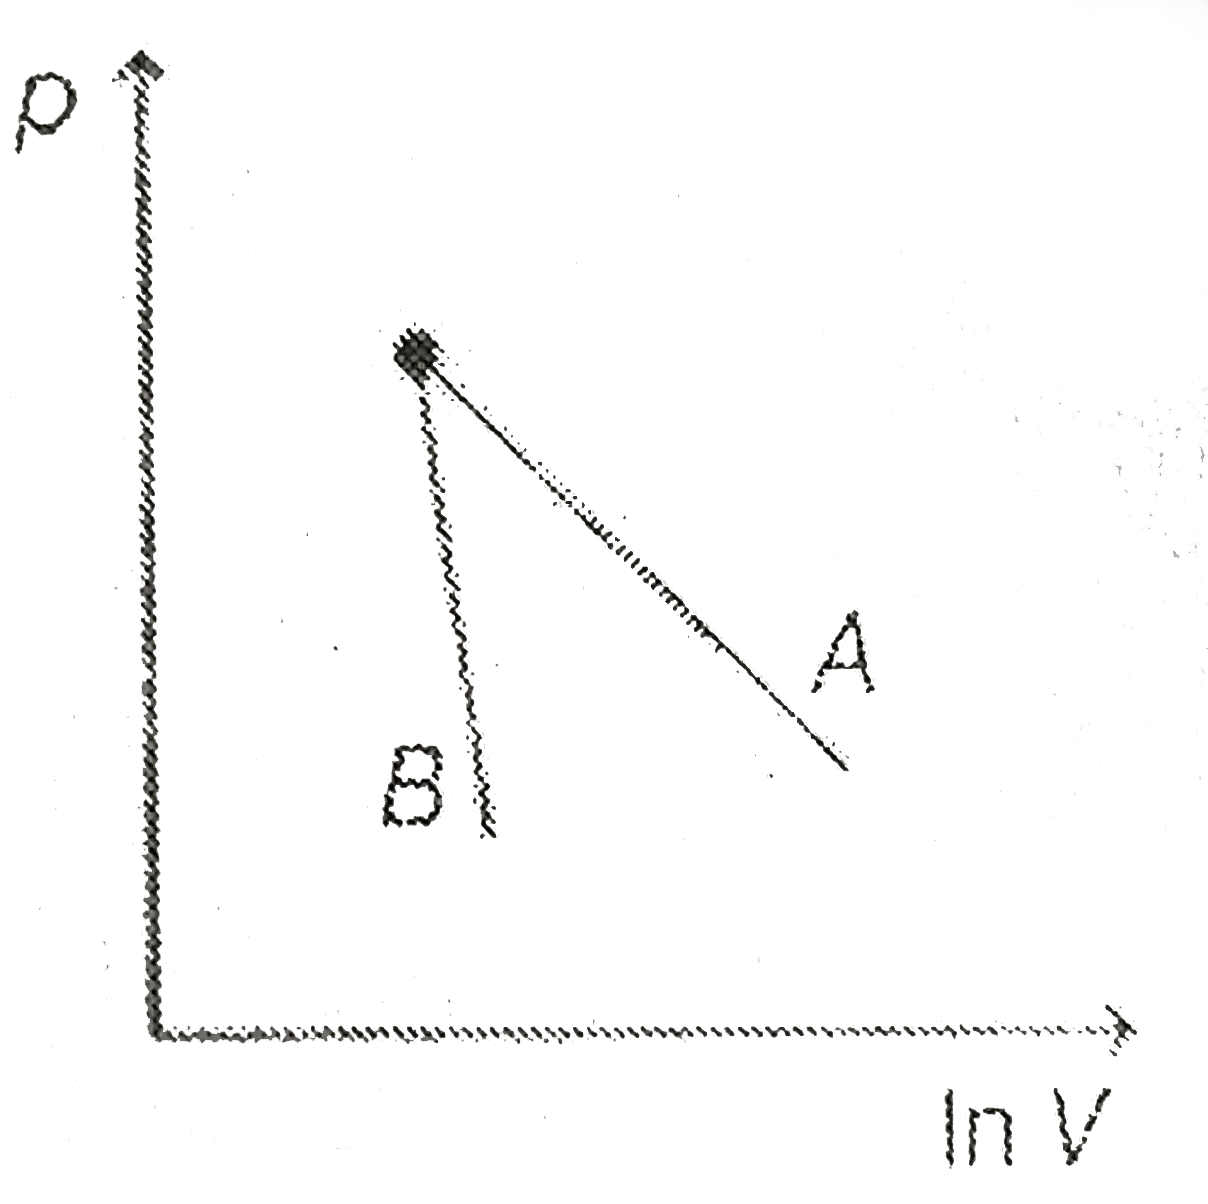
- The figure shows the graph of logarithmic reading of pressure and volu...
Text Solution
|
- Figure shows the stress-strain curve of two metals P and Q . From the ...
Text Solution
|
- Logarithms of readings of pressure and volume for an ideal gas were pl...
Text Solution
|
- In figure, A and B are two adiabatic curves for two different gases. T...
Text Solution
|
- An ideal gas undergoes a process consisting of adiabatic and isotherma...
Text Solution
|
- An ideal monatomic gas undergoes a cyclic process ABCA as shown in the...
Text Solution
|
- The figure shows the graph of logarithmic reading of pressure and volu...
Text Solution
|
- The figure shows the graph of logarithmic reading of pressure and volu...
Text Solution
|
- P - V plots for two gases, undergoing adiabatic processes are as shown...
Text Solution
|