


Similar Questions
Explore conceptually related problems
Recommended Questions
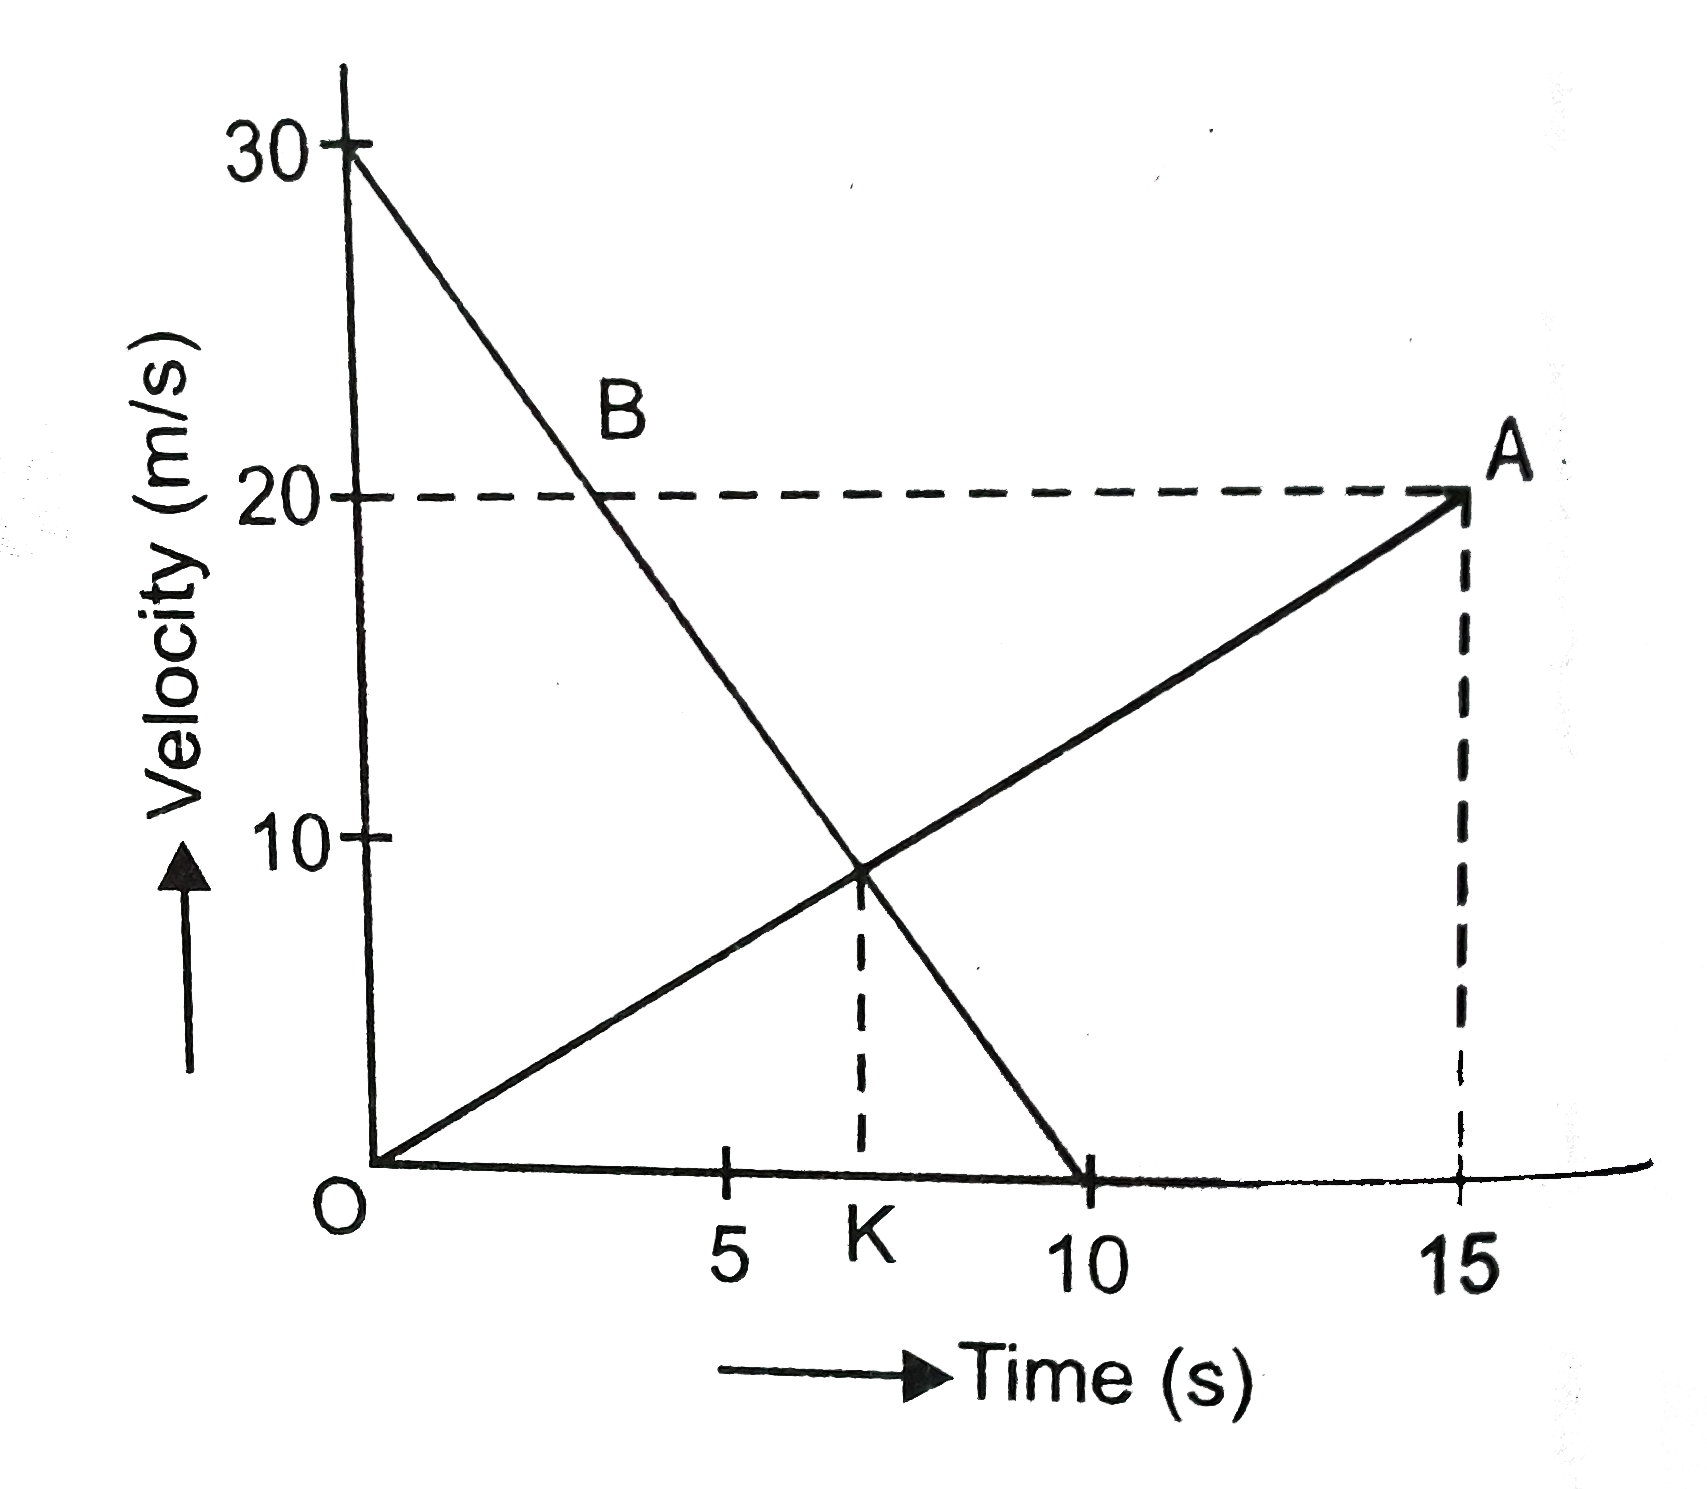
- The velocity time graphs of two bodies A and B are shown in Figure. Ob...
Text Solution
|
- If velocity-time graph of a body is as shown in figure, what is the na...
Text Solution
|
- From velocity time graph of bodies A and B , what do you infer about t...
Text Solution
|
- (a) The velocity time graph of two bodies are shown in Figure. Slope o...
Text Solution
|
- The ditance time graph of two bodies A and B are shown in Figure. Obse...
Text Solution
|
- The velocity time graphs of two bodies A and B are shown in Figure. Ob...
Text Solution
|
- Draw velocity-time graph of a unitorm motion of an object along a stra...
Text Solution
|
- निम्न ग्राफों का ढलान क्या प्रदर्शित करता है? (i)स्थिति-समय ग्राफ, (...
Text Solution
|
- [" The acceleration of a "],[" moving body can be found "],[" from "],...
Text Solution
|