


Similar Questions
Explore conceptually related problems
Recommended Questions
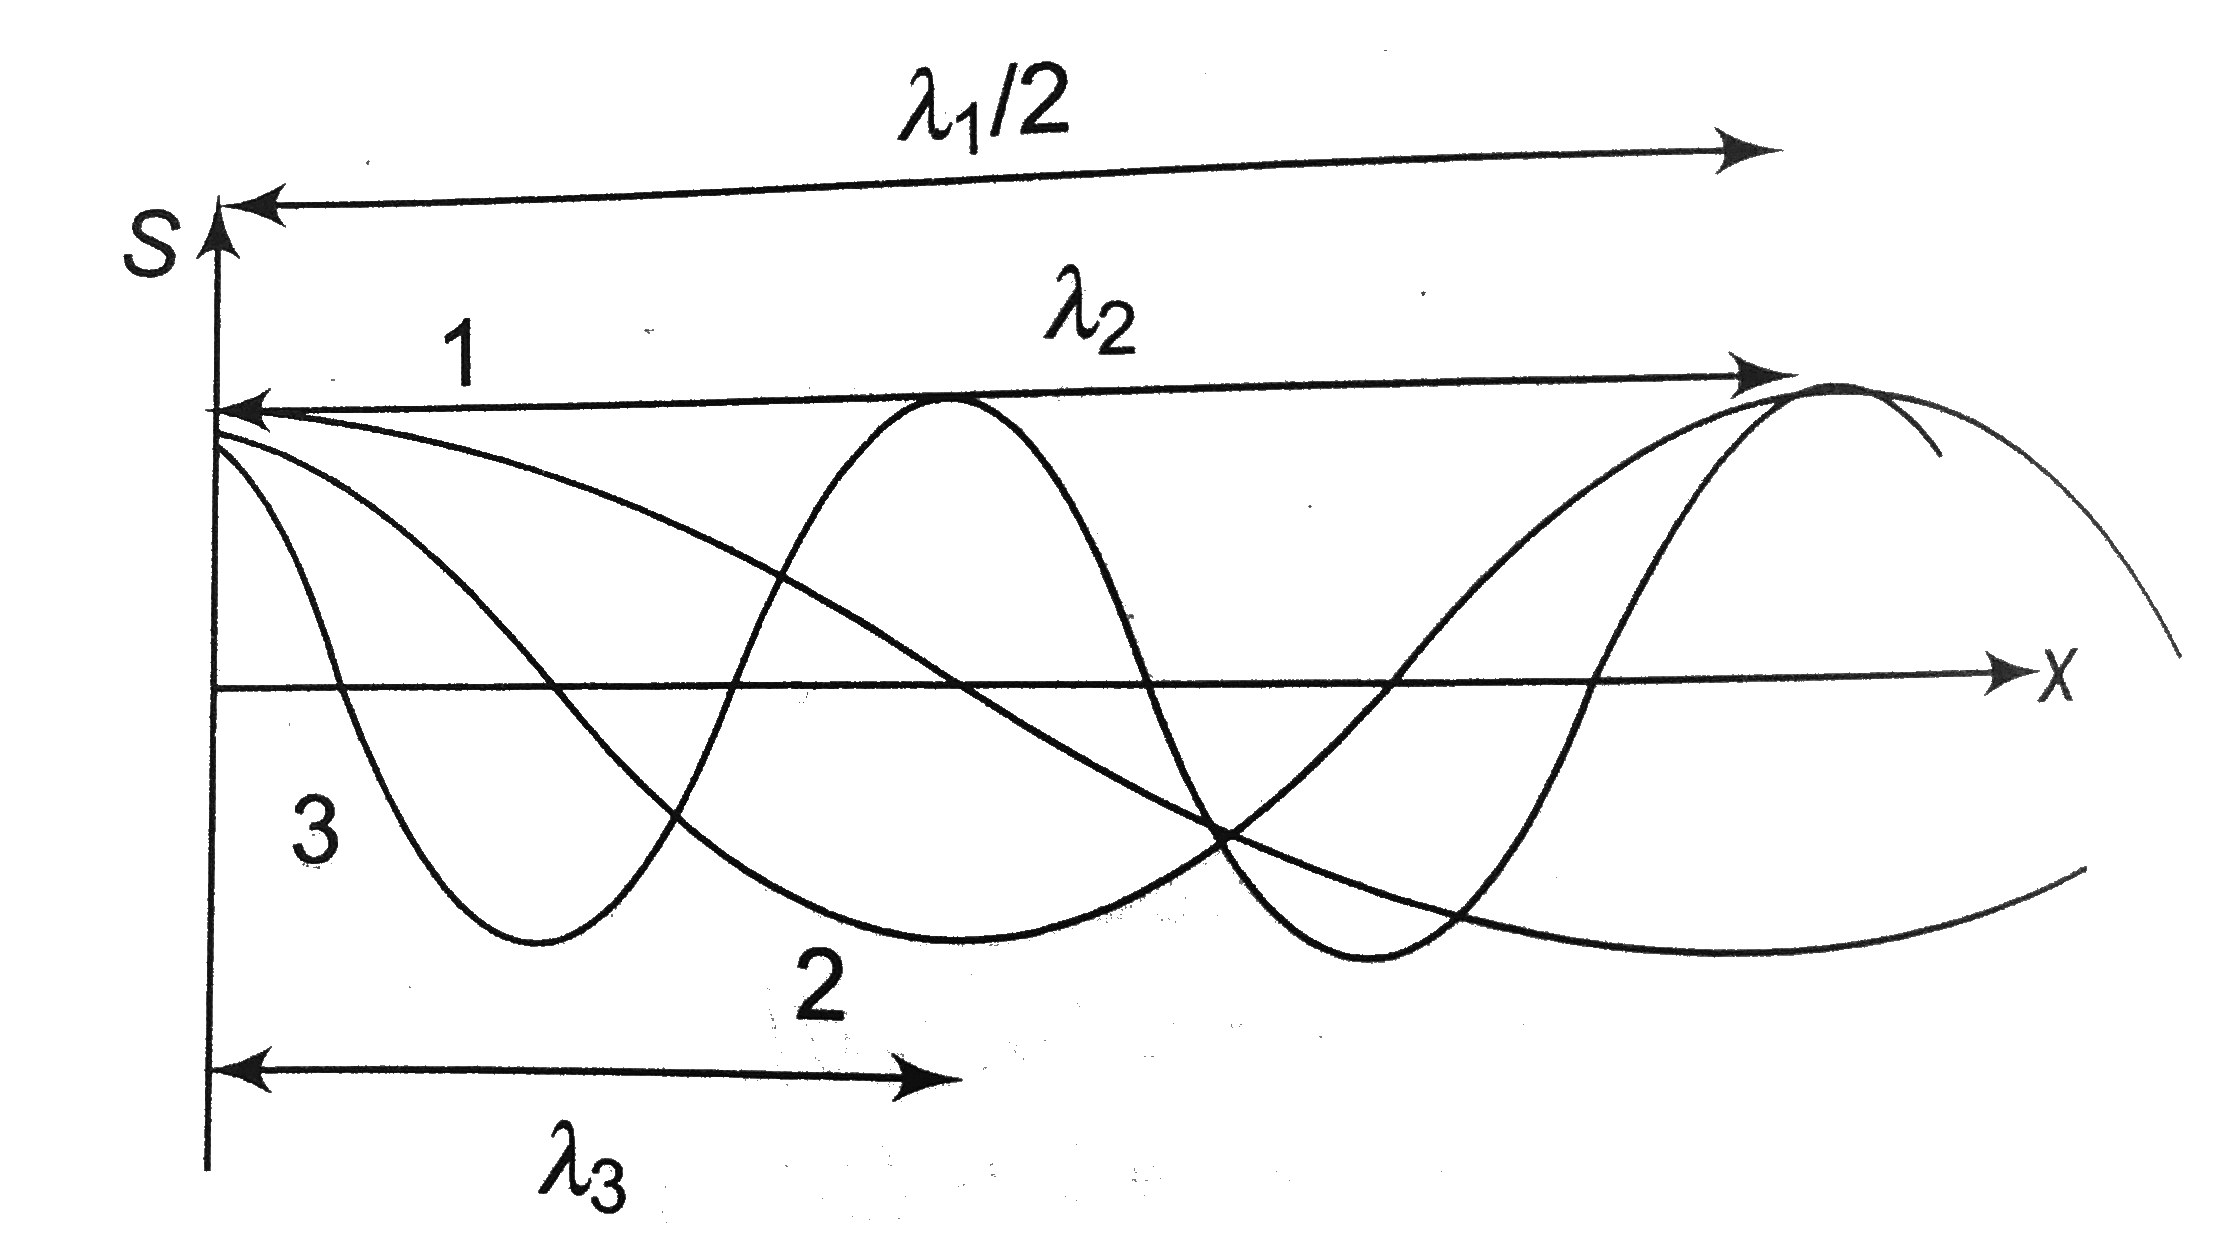
- Figure shown is a graph at a certain time t, of the displacement funct...
Text Solution
|
- Figure shown is a graph at a certain time t, of the displacement funct...
Text Solution
|
- For V versus T curves at constant pressure P1 and P2 for and ideal gas...
Text Solution
|
- In V-T diagram shown in fig., what is the relation between P1 and P2 ?
Text Solution
|
- Figure shows the graph of x - coordinate of a particle moving along x ...
Text Solution
|
- The velocity (v) - time (t) graph for a particle moving along x - axis...
Text Solution
|
- Unpolarised light of intensity I0 passes through two polaroids P1 and ...
Text Solution
|
- किसी निश्चित दिशा में गतिमान किसी कण के चाल-समय ग्राफ को चित्र में दर्...
Text Solution
|
- Tangent at a point P1 [other than (0,0)] on the curve y=x^3 meets the ...
Text Solution
|