A
B
C
D
Text Solution
Verified by Experts
The correct Answer is:


Topper's Solved these Questions
Similar Questions
Explore conceptually related problems
MCGROW HILL PUBLICATION-WORK AND ENERGY-HIGHER ORDER THINKING QUESTIONS
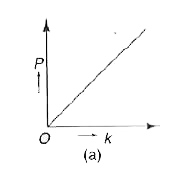
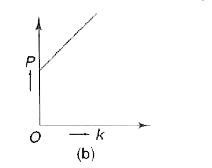
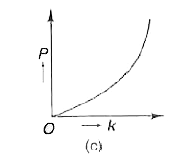
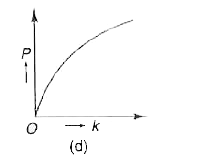
- Which of the following graphs represents the graphical relation betwee...
Text Solution
|
- Which of the following units is different from others ?
Text Solution
|
- If theta is smaller angle between force vector vec(F) and velocity ve...
Text Solution
|
- If p and E represent linear momentum and kinetic energy respectively, ...
Text Solution
|
- the correct variation between sqrt(E) and p is shown by
Text Solution
|
- In question 62, the correct variation between sqrt(E) and (1)/(sqrt(p)...
Text Solution
|
- When a body is in dynamic equilibrium, then work done is
Text Solution
|
- The slope of work-time curve at any instant gives
Text Solution
|
- Area under power-time curve gives
Text Solution
|
- The violation of any law of conservation indi- cates that
Text Solution
|
- When water is flowing through a pipe with a speed v, then its power is...
Text Solution
|
- If the momentum of a body is increased n times, its kinetic energy inc...
Text Solution
|
- When speed of a vehicle becomes n times, with the application of same ...
Text Solution
|
- The slope of potential energy versus position graph represents
Text Solution
|
- A person holds a bucket of weight 80 N. He walks 8 m along the horizon...
Text Solution
|
- The amount of work done in pumping water out of a cubical vessel of he...
Text Solution
|
- A body is under the action of two equal and op- posite forces, each 5 ...
Text Solution
|
- A motor drives a body along a straight line with a constant force. The...
Text Solution
|
- An automobile engine of mass m accelerates and a constant power Pis ap...
Text Solution
|
- A body moves from rest with a constant ac- celeration. Which of the fo...
Text Solution
|
- The graph bet ween kinetic energy (E) and speed (v) of the body is cor...
Text Solution
|