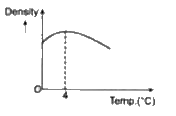
A
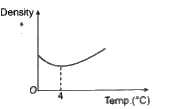
B
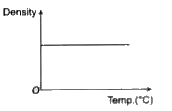
C
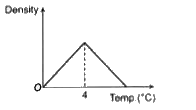
D
Text Solution
Verified by Experts
The correct Answer is:


Topper's Solved these Questions
Similar Questions
Explore conceptually related problems
MCGROW HILL PUBLICATION-HEAT-HIGHER ORDER THINKING QUESTIONS
- The freezing point of ice is
Text Solution
|
- The melting point of ice
Text Solution
|
- A pendulum clock becomes
Text Solution
|
- The amount of heat required to raise the temperature of the entire bod...
Text Solution
|
- The specific heat of water is
Text Solution
|
- If specific heat of a substance is infinite, it means
Text Solution
|
- 336 g of ice at 0^@C is mixed with 336 g of water at 80^@C. What is th...
Text Solution
|
- Which of the following has the highest specific heat?
Text Solution
|
- Water is used as a collent because
Text Solution
|
- Boiling water is changing into steam. Under this condition the specifi...
Text Solution
|
- Which of the following graphs shows variation between density of water...
Text Solution
|
- A bottle of water at 0^@C is opened on the surface of moon. What will ...
Text Solution
|
- In a pressure cooker, cooking is faster because the increases in vapou...
Text Solution
|
- Two blocks of ice when pressed together join to form one block. It hap...
Text Solution
|
- SI unit of heat is
Text Solution
|