


Similar Questions
Explore conceptually related problems
Recommended Questions
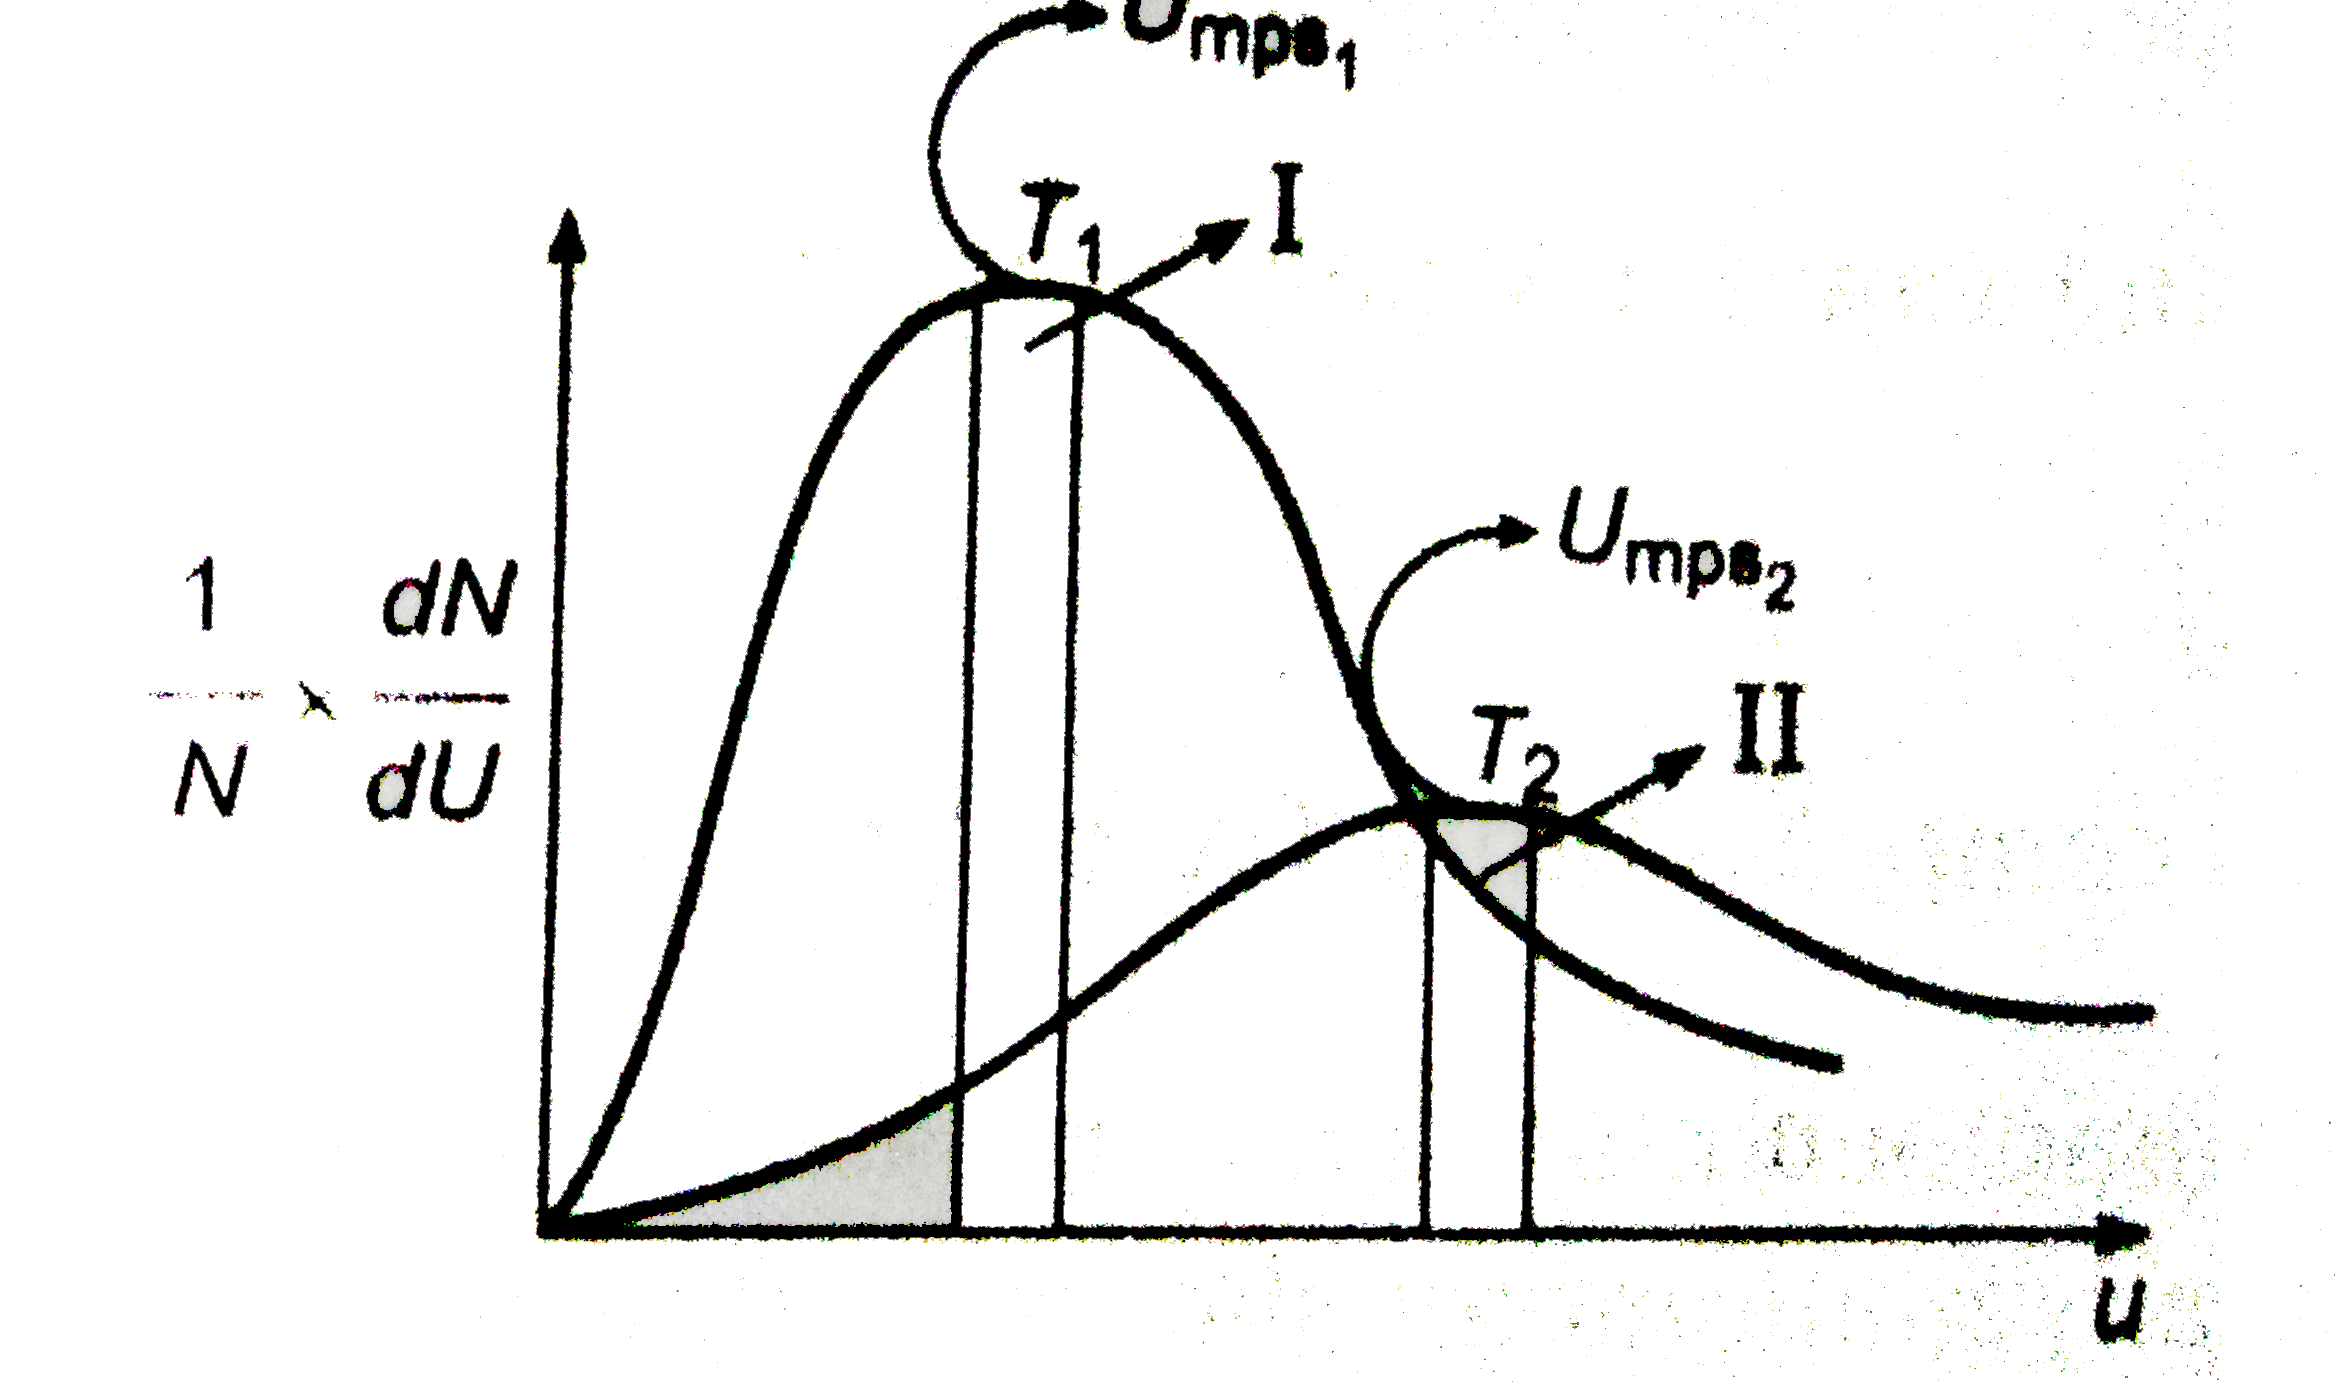
- Following represents the Maxwell distribution curve for an ideal gas a...
Text Solution
|
- Shown below are the black body radiation curves at temperature T(1) an...
Text Solution
|
- Figure shows graphs of pressure vs density for an ideal gas at two tem...
Text Solution
|
- Figure shows graphs of pressure versus density for an ideal gas at two...
Text Solution
|
- For O(2) gas at T(1) and T(2) following Maxwell speed distribution is ...
Text Solution
|
- Following represents the Maxwell distribution curve for an ideal gas a...
Text Solution
|
- Figure shows graphs of pressure vs density for an ideal gas at two tem...
Text Solution
|
- Two curves are given at temperatures T(1) and T(2) in an isothermal pr...
Text Solution
|
- The given figure shows the maxwell distribution of molecular speeds of...
Text Solution
|