


Similar Questions
Explore conceptually related problems
Recommended Questions
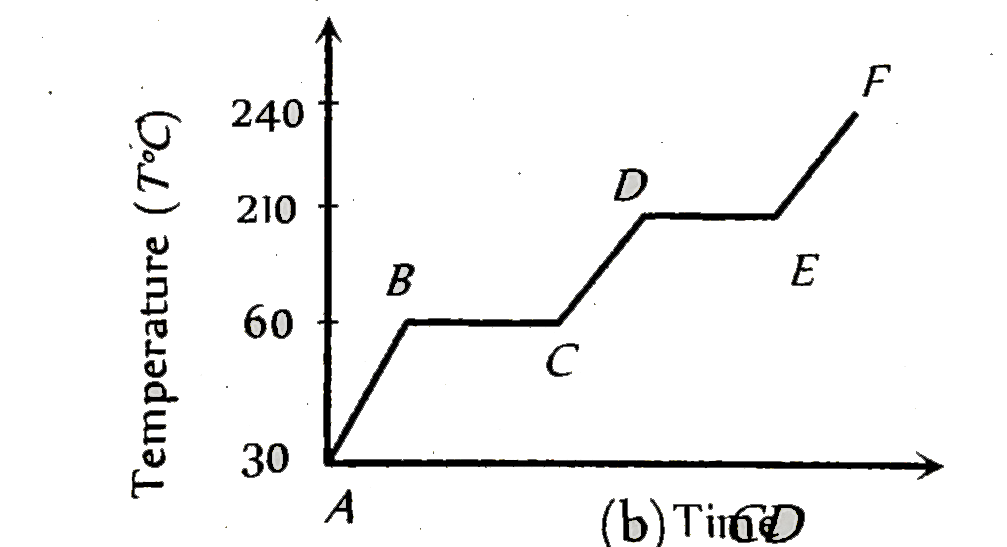
- A solid substance is at 30^(@)C . To this substance heat energy is sup...
Text Solution
|
- If specific ehat capacity of a substance in solid and liquid state is ...
Text Solution
|
- A solid substance is at 30^(@)C . To this substance heat energy is sup...
Text Solution
|
- The temperatures versus time graph is shown in figure. Which of the su...
Text Solution
|
- A well insulated substance in solid state is heated at a constant rate...
Text Solution
|
- A substance is in the solid from at 0^(@)C . The amount of heat added ...
Text Solution
|
- A source of heat supplies heat at constant rate to a solid cube. The v...
Text Solution
|
- The temperatures versus time graph is shown in figure. Which of the su...
Text Solution
|
- The diagram below shows the change of phases of a substance on a tempe...
Text Solution
|