


Similar Questions
Explore conceptually related problems
Recommended Questions
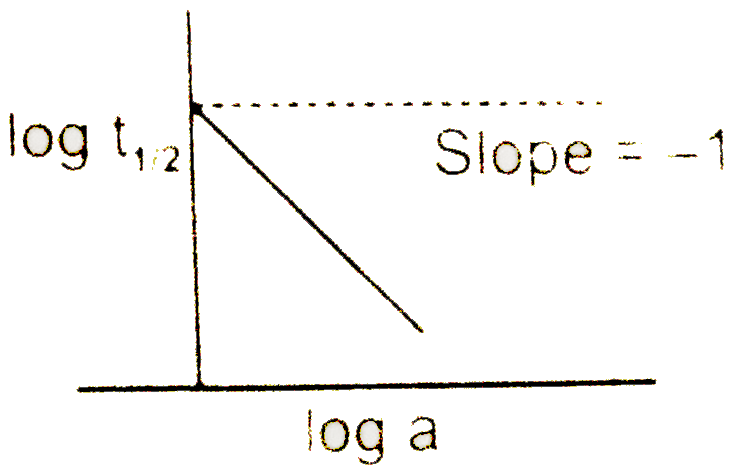
- A graph between log t((1)/(2)) and log a (abscissa), a being the init...
Text Solution
|
- Following is the graph between log T(50) and log a ( a = initial conce...
Text Solution
|
- Following is the graph between log t(1//2) and log a (a initial concen...
Text Solution
|
- A graph between log t((1)/(2)) and log a (abscissa), a being the initi...
Text Solution
|
- Following is the graph between log T(50) and log a (a = initial concen...
Text Solution
|
- For a second order reaction, 2" A"to Products, a plot of log t(1//2) v...
Text Solution
|
- The graph between log t(1//2) and log a at a given temperature is ...
Text Solution
|
- A graph between log t((1)/(2)) and log a (abscissa), a being the init...
Text Solution
|
- A graph between log t(1//2) and log a (abscissa), a being the initial ...
Text Solution
|