


Similar Questions
Explore conceptually related problems
Recommended Questions
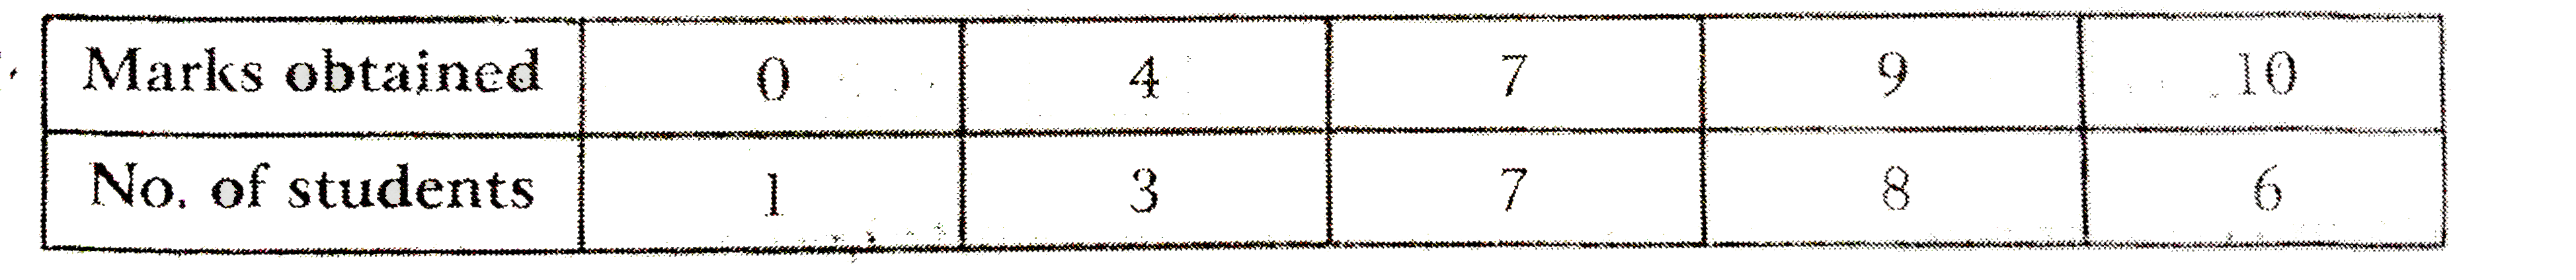
- The table shows the marks obtained by 25 students in a class test. Fin...
Text Solution
|
- The table shows the marks obtained by 25 students in a class test. Fin...
Text Solution
|
- Determine the point of symmetry of a regular hexagon. <img src="htt...
Text Solution
|
- Match the following Column A to Column B
Text Solution
|
- Match the following Column A to Column B
Text Solution
|
- Match the following Column A to Column B
Text Solution
|
- Find the area of figure given below.
Text Solution
|
- Find the perimeter of the figure given below.
Text Solution
|
- Find the area of the figure given below.
Text Solution
|