


Similar Questions
Explore conceptually related problems
Recommended Questions
- P – V graph for a cyclic process is shown in figure . Work done is giv...
Text Solution
|
- An ideal gas underoges cyclic process of ABCDA as shown in Given P-V d...
Text Solution
|
- In the cyclic process shown in the V-P diagram the magnitude of the wo...
Text Solution
|
- In a cyclic process shown on the P -V diargam the magnitude of the wor...
Text Solution
|
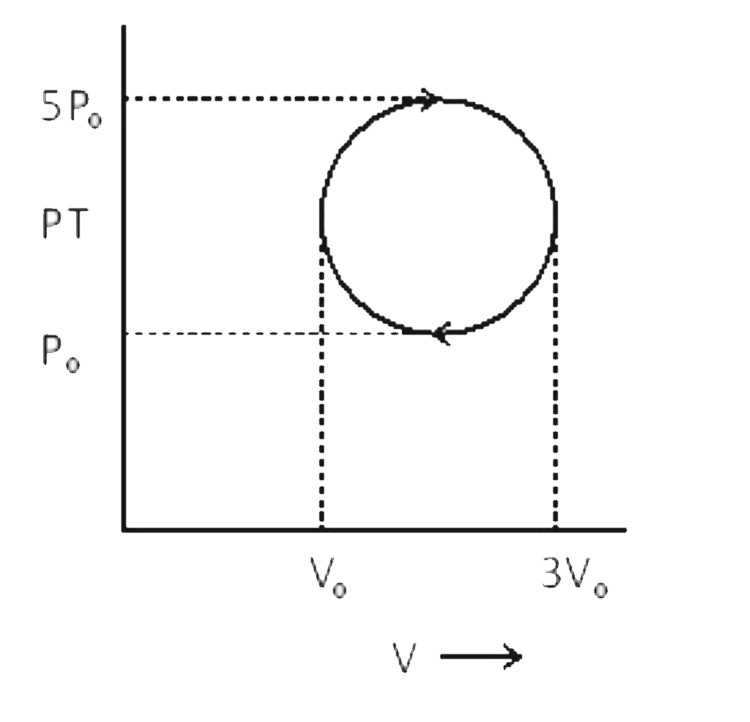
- In the cyclic process shown in P-V diagram the magnitude of work done ...
Text Solution
|
- A cyclic process is shown in the figure. Work done during the cyclic p...
Text Solution
|
- P – V graph for a cyclic process is shown in figure . Work done is giv...
Text Solution
|
- In the cyclic process shown in P - V diagram, the magnitude of the wor...
Text Solution
|
- A cyclic process is shown in the figure. Work done during the cyclic p...
Text Solution
|