


Similar Questions
Explore conceptually related problems
Recommended Questions
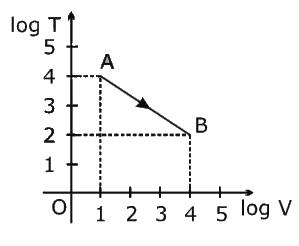
- Figure shows, the adiabatic curve on a log T and log V scale performed...
Text Solution
|
- Figure shows the adiabatic curve for n moles of an ideal gas, the bulk...
Text Solution
|
- The intercept of the line drawm for log P (P in atm) and log (1)/(V) (...
Text Solution
|
- For an ideal gas kept in a container attached manometer as show. Find ...
Text Solution
|
- Figure shows the adiabatic curve on log-log scale performed on a ideal...
Text Solution
|
- Log P vs log V curve is plotted for an ideal gas, which is true for ...
Text Solution
|
- What is the slope of the plot of log P vs log V for a given amount of ...
Text Solution
|
- For an ideal gas, under isobaric condition, a graph between log V vs l...
Text Solution
|
- Figure shows, the adiabatic curve on a log T and log V scale performed...
Text Solution
|