A
B
C
D
Text Solution
Verified by Experts
The correct Answer is:


Similar Questions
Explore conceptually related problems
Recommended Questions
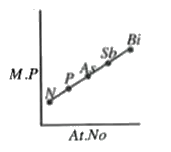
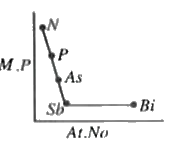
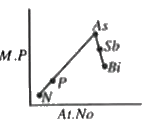
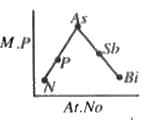
- Which of the following graph represents melting points of the group - ...
Text Solution
|
- which of the follwing hydrides of Group 15 elements has the highest me...
Text Solution
|
- The element with least melting point in VIA group is
Text Solution
|
- Which of the following group elements exhibits high melting and boilin...
Text Solution
|
- Group 13 element with lowest melting point is
Text Solution
|
- Explain the following properties of group 16 elements : (ii) Melting a...
Text Solution
|
- NH3 has exceptionally high melting point and boiling point as compared...
Text Solution
|
- NH3 has exceptionally high melting point and boiling point as compared...
Text Solution
|
- Which of the following elements has lowest melting point -
Text Solution
|