A
B
C
D
Text Solution
Verified by Experts
The correct Answer is:


Topper's Solved these Questions
STATES OF MATTER
AAKASH SERIES|Exercise LECTURE SHEET - EXERCISE - I (LEVEL - II ADVANCED)(MORE THAN ONE CORRECT ANSWER TYPES QUESTIONS)|5 VideosSTATES OF MATTER
AAKASH SERIES|Exercise LECTURE SHEET - EXERCISE - I (LEVEL - II ADVANCED)(LINKED COMPREHENSION TYPES QUESTIONS)|3 VideosSTATES OF MATTER
AAKASH SERIES|Exercise OBJECTIVE EXERCISE -3|19 VideosSATURATED HYDROCARBONS
AAKASH SERIES|Exercise QUESTIONS FOR DESCRIPTIVE ANSWERS|10 VideosSTOICHIOMETRY
AAKASH SERIES|Exercise QUESTIONS FOR DESCRIPTIVE ANSWERS|59 Videos
Similar Questions
Explore conceptually related problems
AAKASH SERIES-STATES OF MATTER-LECTURE SHEET - EXERCISE - I (LEVEL - II ADVANCED)(STRAIGHT OBJECTIVE TYPES QUESTIONS)
- How much should the pressure be increased in order to decrease the vol...
Text Solution
|
- A cubical vessel has a side with ‘l’ cm length contained a gas at a pr...
Text Solution
|
- Four one litre flasks are seperately filled with gases O2,F2, CH4 and ...
Text Solution
|
- N2 gas is present in one litre flask at a pressure of 7.6 xx 10^(-10)m...
Text Solution
|
- One mole of argon will have least density at
Text Solution
|
- By taking two J-tubes at constant temperature what is the difference i...
Text Solution
|
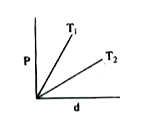
- Diagram shows a graph between pressure and density for an ideal gas at...
Text Solution
|
- Which among the following indicates change in the chemical composition...
Text Solution
|
- Balloons of 4L capacity are to be filled with Hydrogen at a pressure o...
Text Solution
|
- A 10 lt vessel contains He gas at 10 atm and TK .How many balloons of...
Text Solution
|
- An open flaskh has Helium gas at 2 atm and 327^@C. The flask is heated...
Text Solution
|