


Similar Questions
Explore conceptually related problems
Recommended Questions
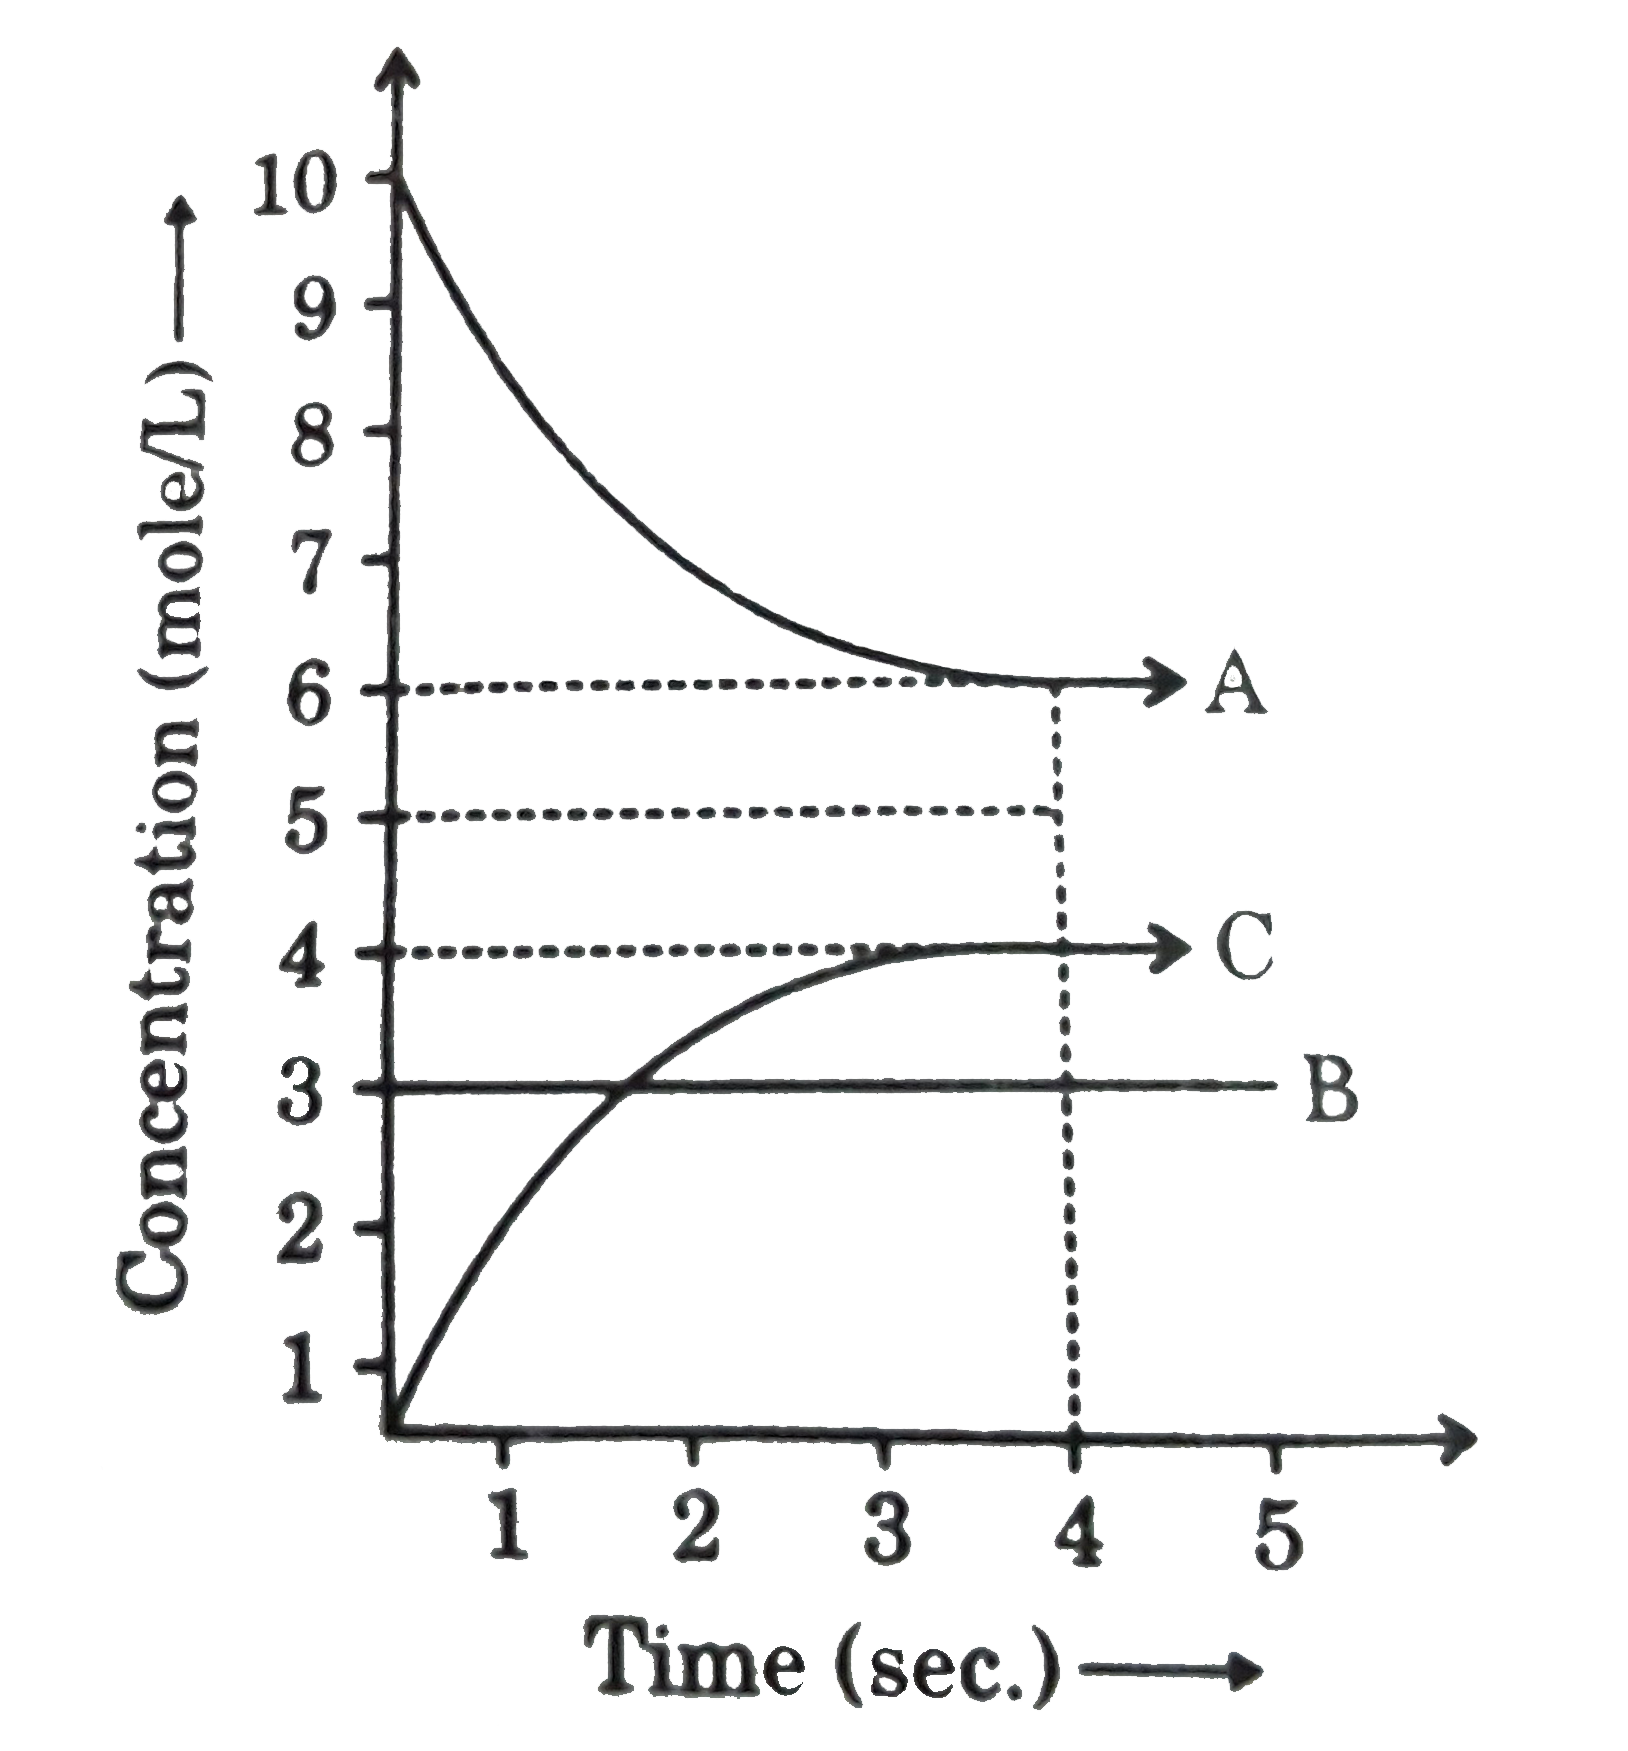
- A,B and C react in the 1:1:1 stoichiometric ratio. The concentration o...
Text Solution
|
- X, Y and Z react in the 1:1:1 stoichiometric ratio. The concentration ...
Text Solution
|
- X, Y and Z react in the 1:1:1 stoichiometric ratio. The concentratio...
Text Solution
|
- X, Y and Z react in the 1:1:1 stoichiometric ratio. The concentration ...
Text Solution
|
- For the reaction A+B hArr C+D , the initial concentrations of A and B ...
Text Solution
|
- In the reaction, A + B hArr2C, at equilibrium, the concentration of A ...
Text Solution
|
- A,B and C react in the 1:1:1 stoichiometric ratio. The concentration o...
Text Solution
|
- A,B and C react in the 1:1:1 stoichiometric ratio. The concentration o...
Text Solution
|
- Consider the reaction A to B. The concentration of both the reactan...
Text Solution
|