A
B
C
D
Text Solution
Verified by Experts
The correct Answer is:


Similar Questions
Explore conceptually related problems
Recommended Questions
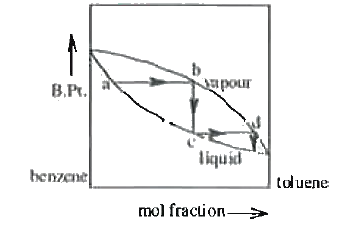
- A graph is plotted with temperature of a solution containing benzene a...
Text Solution
|
- A graph is plotted between the vapour pressure and mole fraction of a ...
Text Solution
|
- The mole fraction of toluene in vapour phase which is in equlibrium wi...
Text Solution
|
- Vapour pressure of pure benzene is 119 torr and that of toluene is 37....
Text Solution
|
- Calculate the mole fraction of toluence in the vapour phase which is i...
Text Solution
|
- Benzene and toluene have equal mole fractions in their mutual solution...
Text Solution
|
- The mole fraction fo benzene in a solution with toluene is 0.50 . ...
Text Solution
|
- Calculate the mole fraction of toluene in the vapour phase which is in...
Text Solution
|
- The mole fraction of toluene in vapour phase which is in equilibrium w...
Text Solution
|