A
B
C
D
Text Solution
Verified by Experts
The correct Answer is:


Topper's Solved these Questions
BIOMOLECULES
AAKASH SERIES|Exercise EXERCISE - III (Previous AIPMT/NEET Questions)|84 VideosBIOMOLECULES
AAKASH SERIES|Exercise EXERCISE - III (Previous AIPMT/NEET Questions) (Enzymes)|11 VideosBIOMOLECULES
AAKASH SERIES|Exercise EXERCISE - II (Nucleic acids)|59 VideosBIOLOGICAL CLASSIFICATION
AAKASH SERIES|Exercise EXERCISE-III (Previous AIPMT/NEET Question)|37 VideosCELL CYCLE AND CELL DIVISION
AAKASH SERIES|Exercise Exercise-III|18 Videos
Similar Questions
Explore conceptually related problems
AAKASH SERIES-BIOMOLECULES-EXERCISE - II (Enzymes)
- The enzyme which is added to baby foods to predigest them is
Text Solution
|
- An enzyme which increases the rate of permeability across the membrane...
Text Solution
|
- Which of the following reactions is not enzyme - mediated in biologica...
Text Solution
|
- Refer the given reaction un derset("Maltose")(C(12)H(22)O(11))+H(2)O...
Text Solution
|
- Which of the following statements is incorrect regarding enzymatic act...
Text Solution
|
- What is denoted by X and Y in the given graph? {:("X","Y"),("1) ...
Text Solution
|
- Enzymes that catalyse removal of groups from substrates by mechanisms ...
Text Solution
|
- Feed back inhibition of enzyme action is affected by
Text Solution
|
- Michaelis Menten Constant (K) is equal to
Text Solution
|
- Which of the following is an example of isozyme?
Text Solution
|
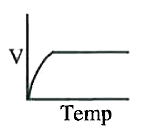
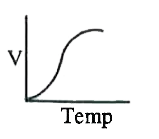
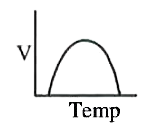
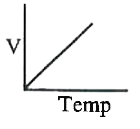
- Which one of the given graphs shows the effect of temperature on the v...
Text Solution
|
- The standard free energy change and standard activation energy for fou...
Text Solution
|
- Holoenzyme is the complete enzyme consisting of an apoenzyme and a cof...
Text Solution
|