Text Solution
Verified by Experts


Topper's Solved these Questions
NCERT EXEMPLAR ENGLISH-ORGANISMS AND POPULATIONS-Long Answer Type Questions
- Comment on the following figure: I, II and III, A, B, C, D, G, P, Q, R...
Text Solution
|
- An individual and a population has certain characteristics. Name these...
Text Solution
|
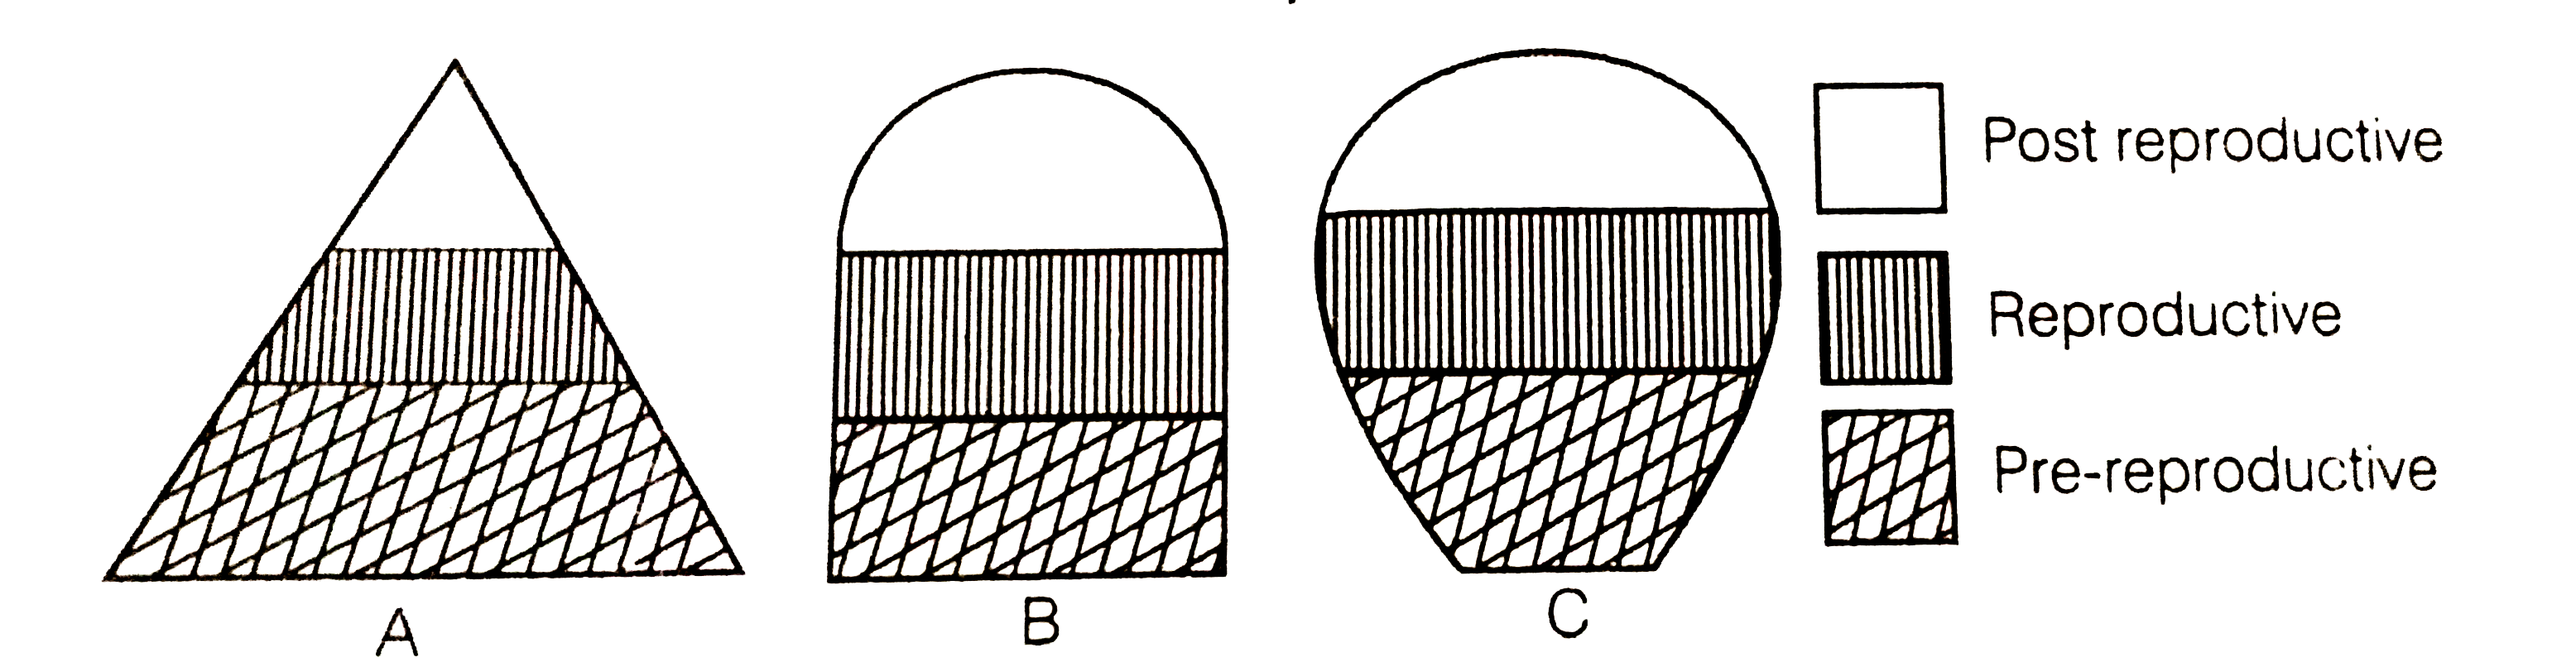
- The following diagrams are the age pyramids of different populations. ...
Text Solution
|
- Comment on the growth curve given below.
Text Solution
|
- A population of Paramecium caudatum was grown in a culture medium. Af...
Text Solution
|
- Discuss the various types of positive interactions between species.
Text Solution
|
- In an aquarium two herbivorous species of fish are living together and...
Text Solution
|
- While living in and on the host species, the animal parasite has evolv...
Text Solution
|
- Do you agree that regional and local variations exist within each biom...
Text Solution
|
- Which element is responsible for causing soil salinity? At what concen...
Text Solution
|
- Does light factor affect the distribution of organisms? Write a brief ...
Text Solution
|
- Give one example for each of the following I. Eurythermal plant spe...
Text Solution
|