 .
.Text Solution
Verified by Experts


Topper's Solved these Questions
Similar Questions
Explore conceptually related problems
NCERT EXEMPLAR ENGLISH-SOUND-Short Answer Type Questions
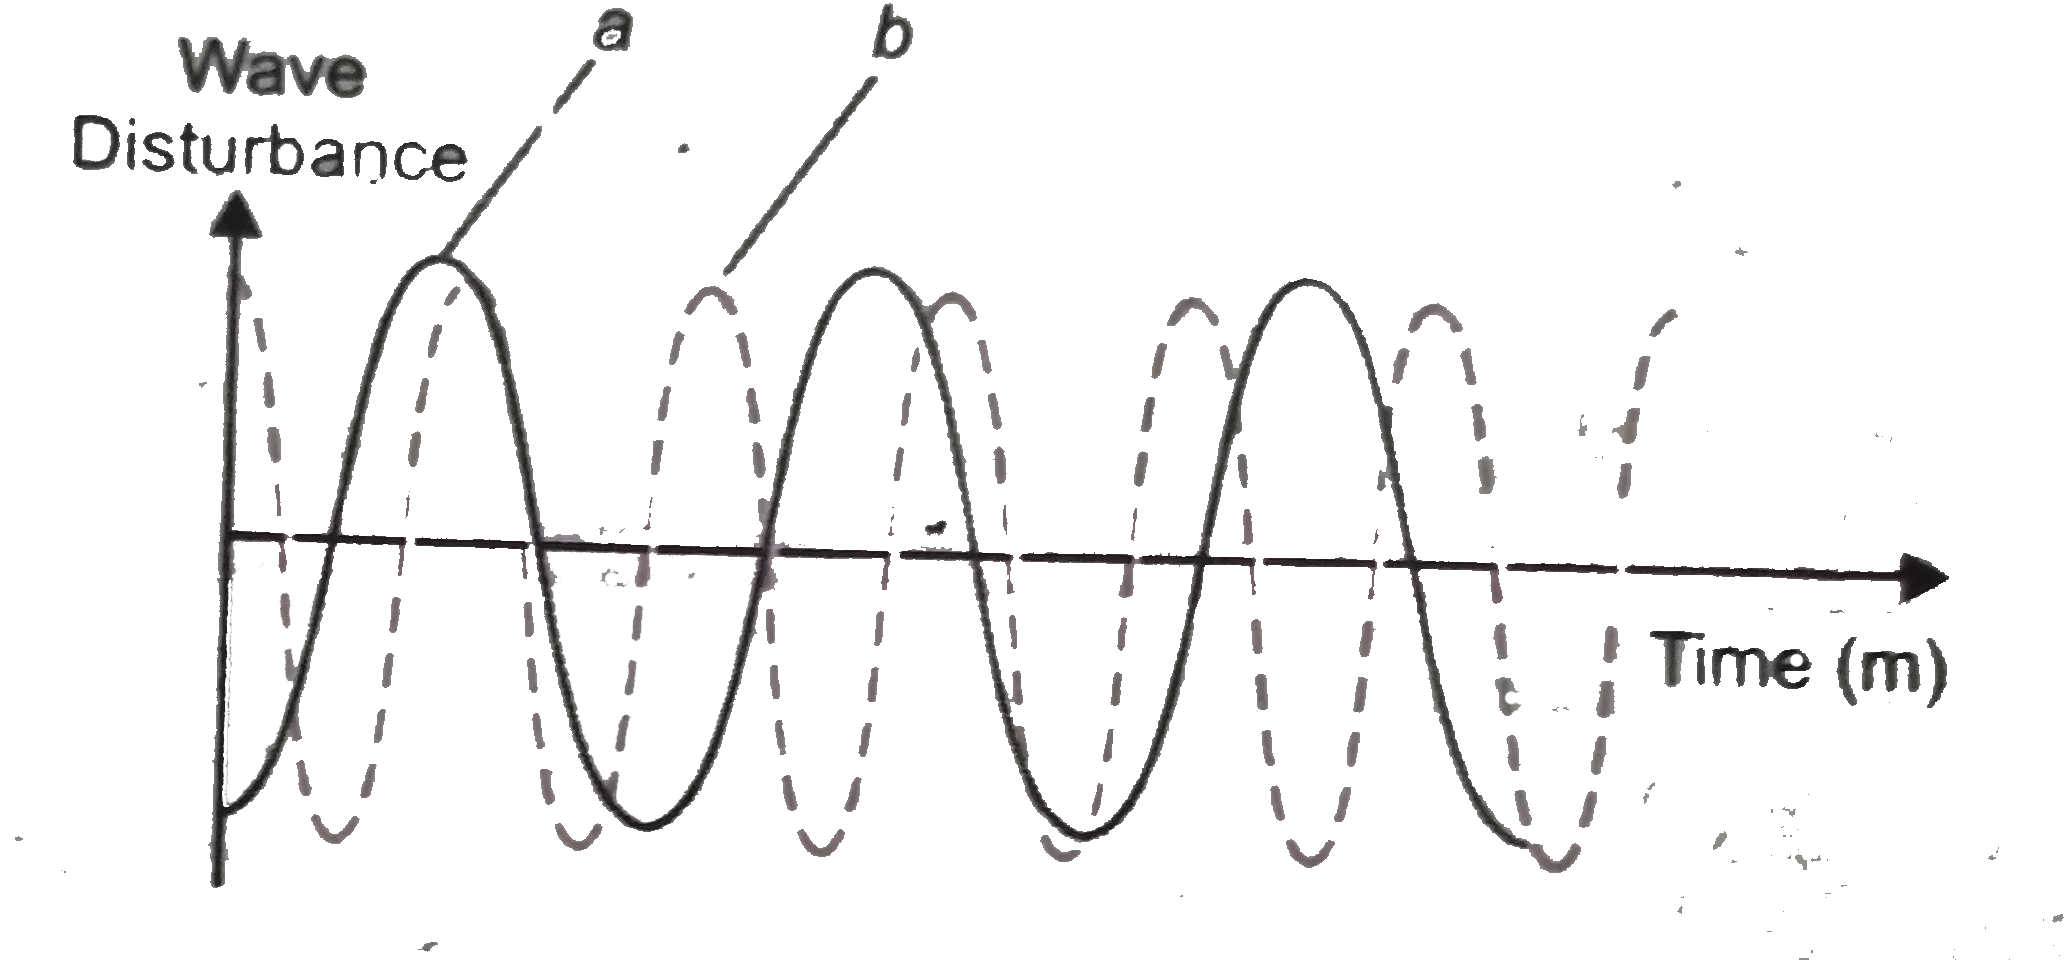
- the displacement versus time relation for a disturbance travelling wit...
Text Solution
|
- Which of the above two graphs : (a) and (b)the human voice is likely t...
Text Solution
|
- A girl is sitting in the middle of a park of dimension 12 m xx 12 m. O...
Text Solution
|
- why do we hear the sound produced by the humming bees while the sound ...
Text Solution
|
- If any explosion takes place at the bottom of a lake, what type of sho...
Text Solution
|
- Sound produced by a thunderstorm is heard 10 s after the lighting is s...
Text Solution
|
- For hearing the loudest ticking sound heard by the ear, find the angle...
Text Solution
|
- Why is the ceiling and wall behind the stage of good conference halls ...
Text Solution
|