A
B
C
D
Text Solution
Verified by Experts
The correct Answer is:


Topper's Solved these Questions
STATES OF MATTER
NCERT EXEMPLAR ENGLISH|Exercise MCQ More Than One Option|4 VideosSTATES OF MATTER
NCERT EXEMPLAR ENGLISH|Exercise Short Answer Type Question|23 VideosSOME BASIC CONCEPTS OF CHEMISTRY
NCERT EXEMPLAR ENGLISH|Exercise All Questions|45 VideosSTRUCTURE OF ATOM
NCERT EXEMPLAR ENGLISH|Exercise All Questions|55 Videos
Similar Questions
Explore conceptually related problems
NCERT EXEMPLAR ENGLISH-STATES OF MATTER-Long Answer Type Question
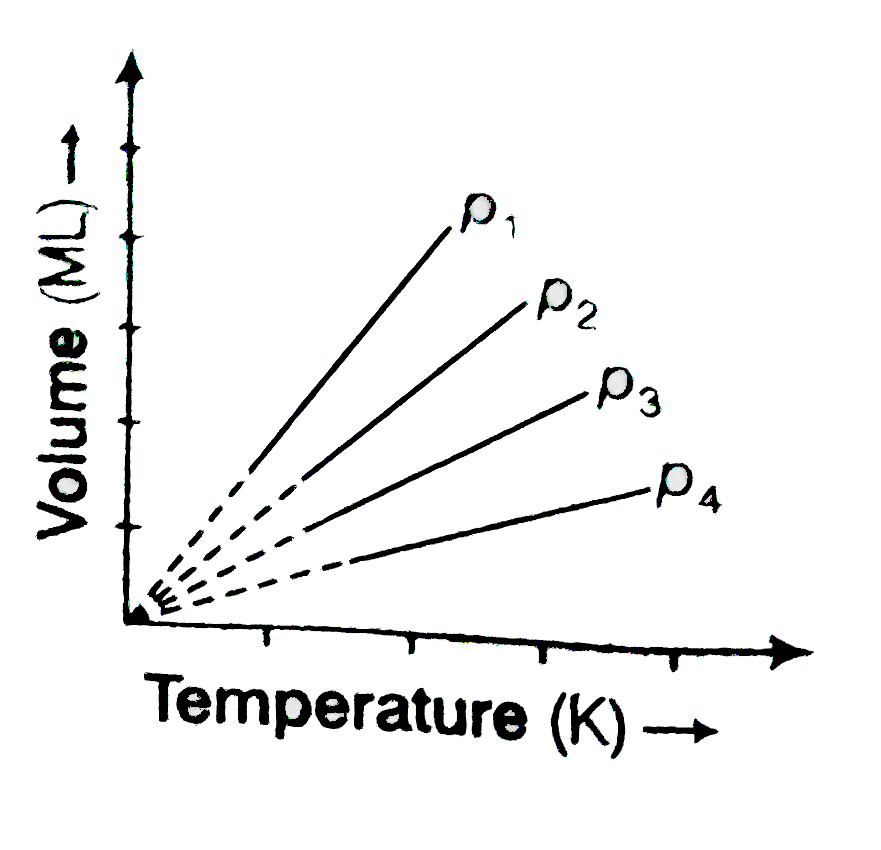
- A plot of volume (V) versus temperature (T) for a gas at constant pres...
Text Solution
|
- The average velocity of CO(2) at the temperature T(1)K and maximum (mo...
Text Solution
|
- The variation of vapour of different liquids with temperature is shown...
Text Solution
|
- Why does the boundary between liquid phase and gaseous phase disappear...
Text Solution
|
- Why does sharp glass edge become smooth on heating it upto its melting...
Text Solution
|
- Explain the term 'laminar flow'. Is the velocity of molecules same in ...
Text Solution
|
- Carbon dioxide unusual because it has no liquid phase at normal atmos...
Text Solution
|