Text Solution
Verified by Experts
Topper's Solved these Questions
STATISTICS AND PROBABILITY
NCERT EXEMPLAR ENGLISH|Exercise SHORT ANSWER TYPE QUESTIONS|20 VideosSTATISTICS AND PROBABILITY
NCERT EXEMPLAR ENGLISH|Exercise LONG ANSWER TYPE QUESTIONS|12 VideosSTATISTICS AND PROBABILITY
NCERT EXEMPLAR ENGLISH|Exercise LONG ANSWER TYPE QUESTIONS|12 VideosQUADRILATERALS
NCERT EXEMPLAR ENGLISH|Exercise LONG ANSWER TYPE QUESTIONS|18 VideosTRIANGLES
NCERT EXEMPLAR ENGLISH|Exercise LONG ANSWER TYPE QUESTIONS|21 Videos
Similar Questions
Explore conceptually related problems
NCERT EXEMPLAR ENGLISH-STATISTICS AND PROBABILITY-VERY SHORT ANSWER TYPES QUESTIONS
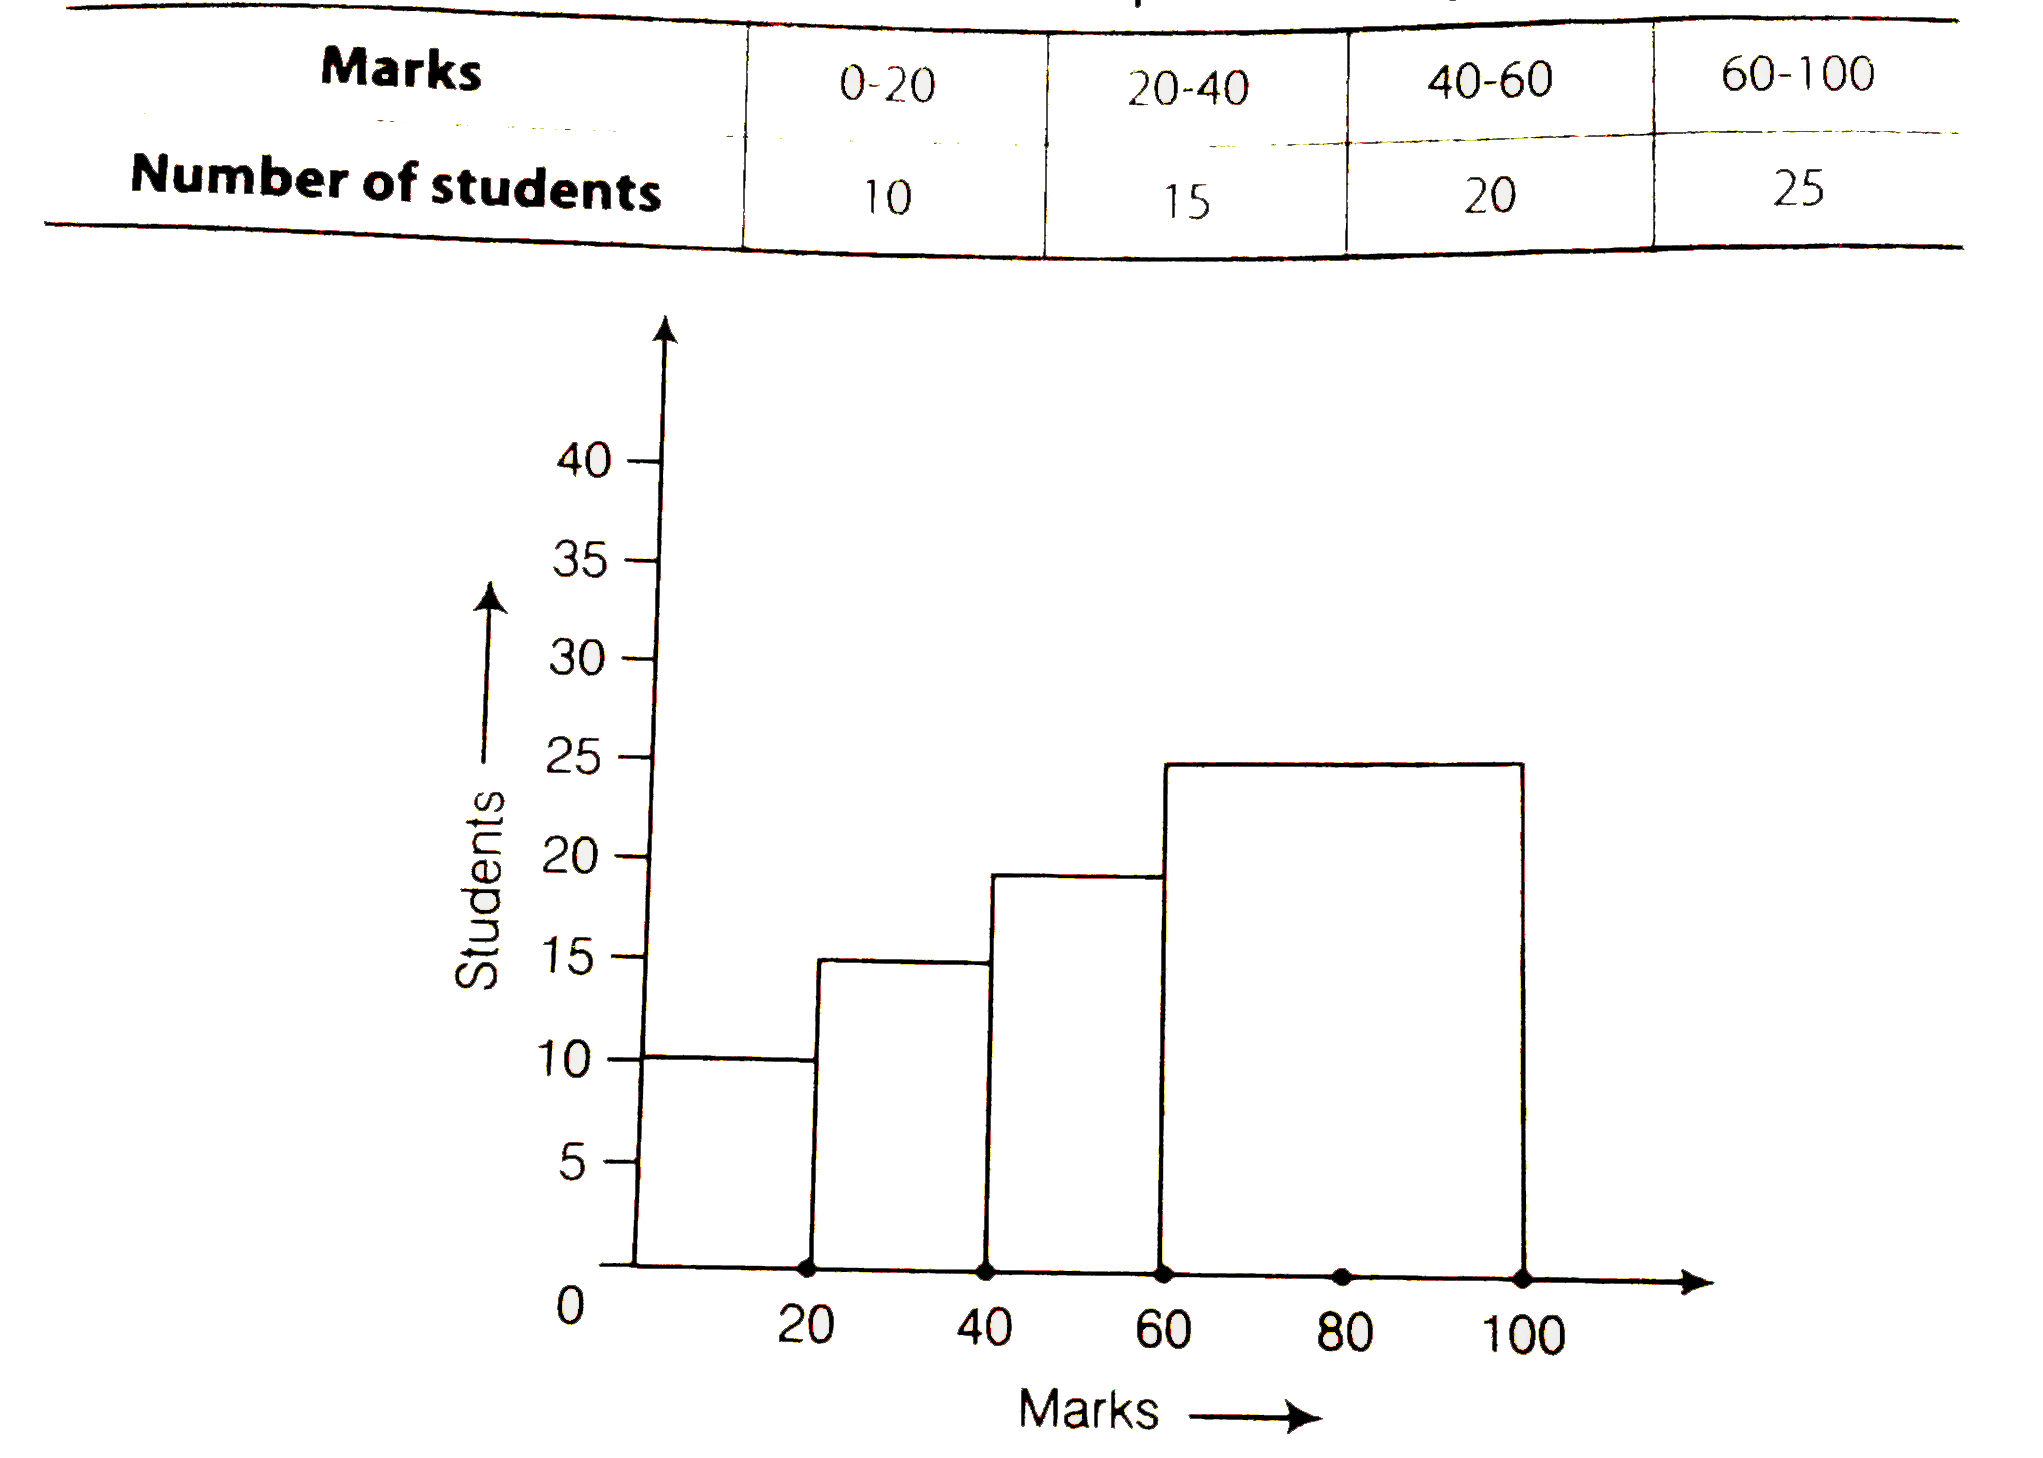
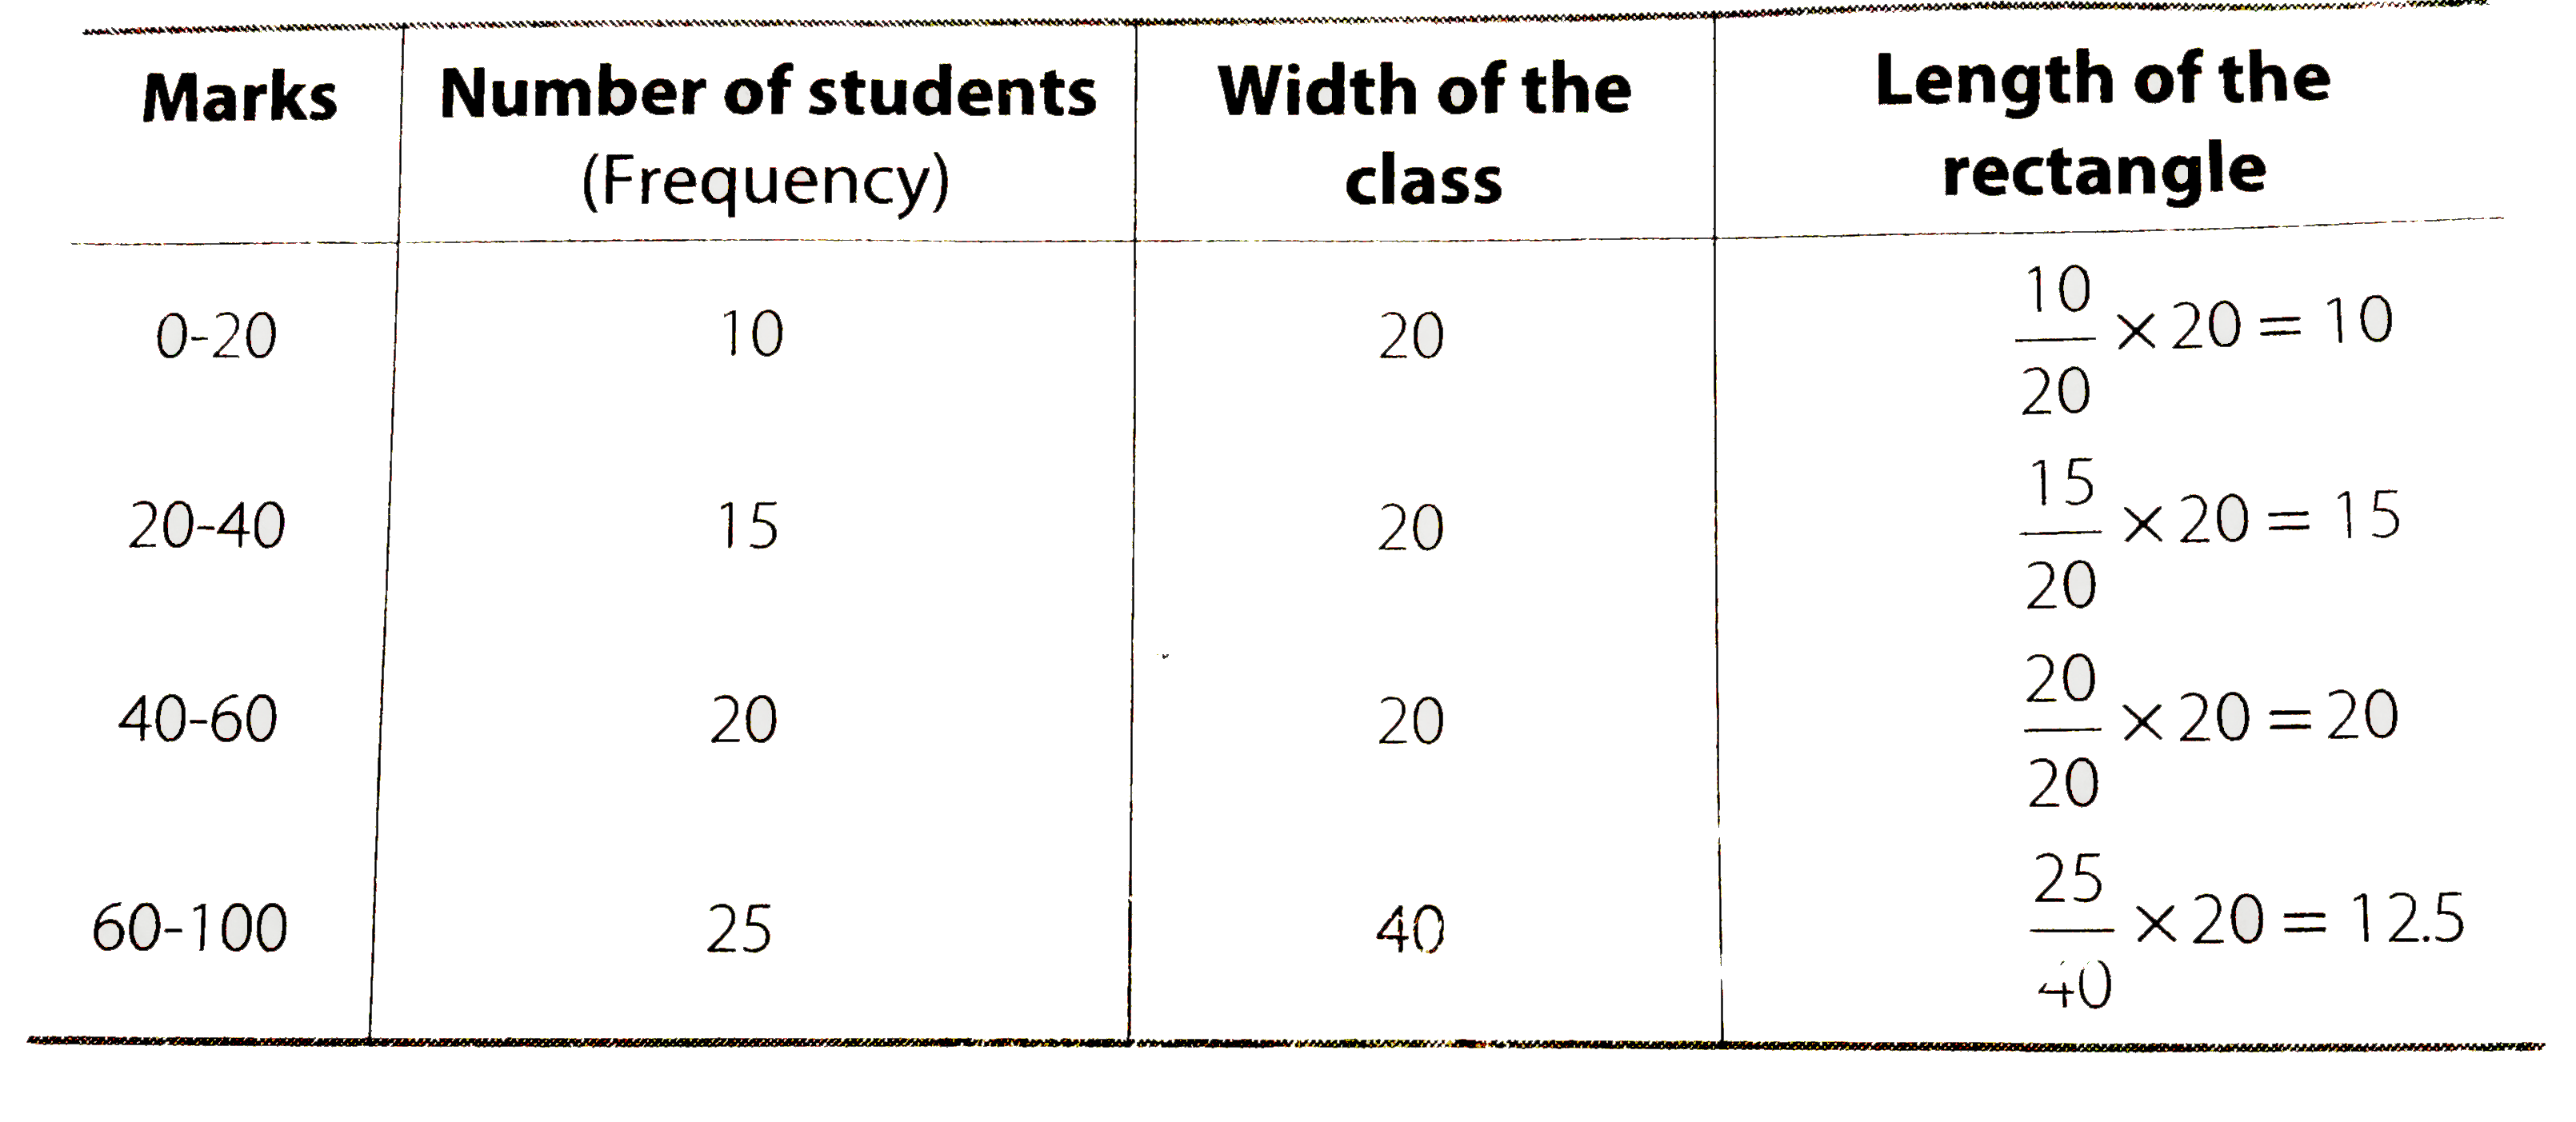
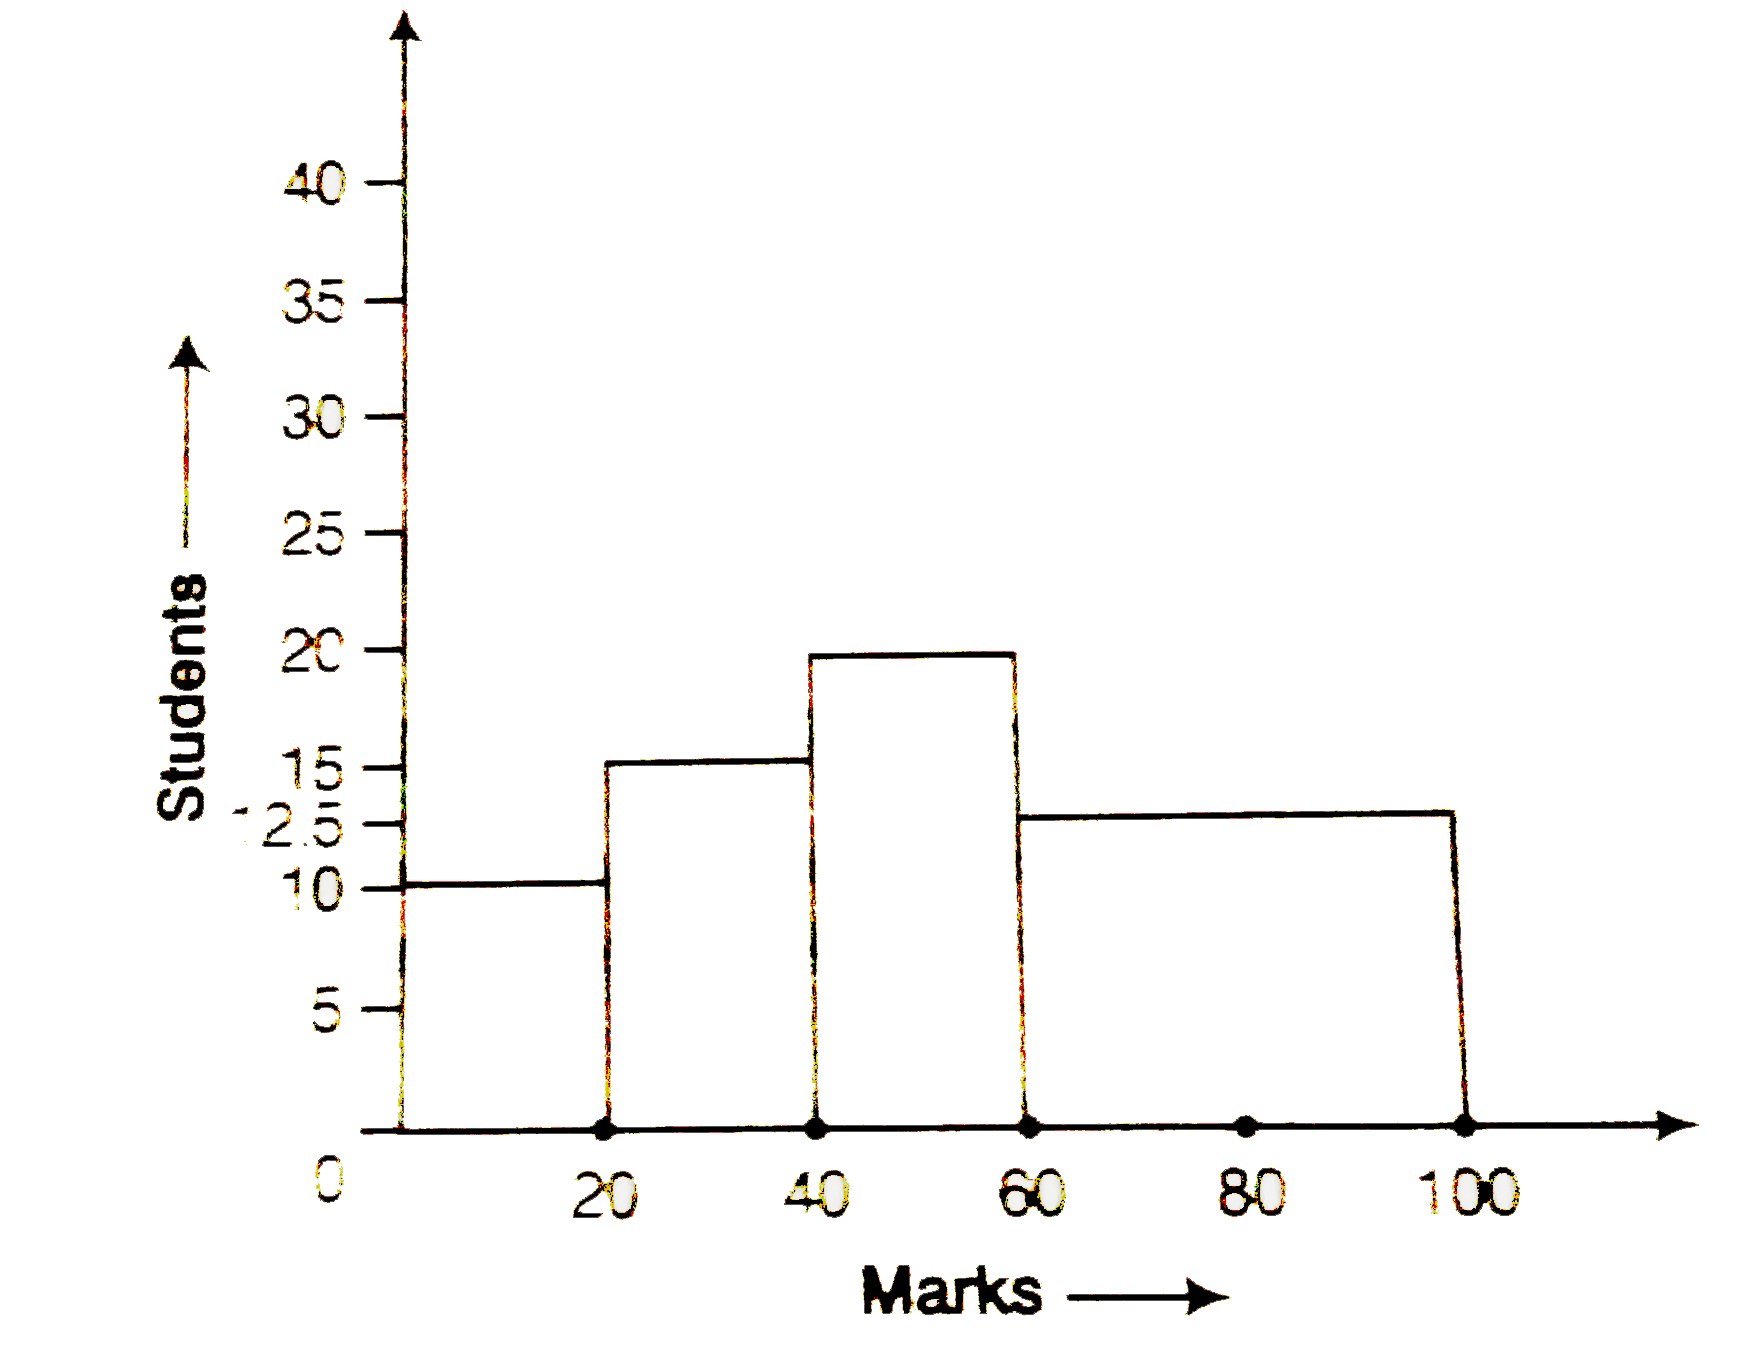
- The frequency distributions been represented graphically as follows. ...
Text Solution
|
- In a diagnostic test in mathematics given to students, the following m...
Text Solution
|
- A child says that the median of 3, 14, 18, 20 and 5 is 18. What does t...
Text Solution
|
- A football player scored the following number of goals in the 10 match...
Text Solution
|
- Is it correct to say that in a histrogram, the area of each rectangle ...
Text Solution
|
- The class marks of a continuous distribution are 1.04, 1.14, 1.24, 1.3...
Text Solution
|
- 30 children were asked about the number of hours they watched TV progr...
Text Solution
|
- Can the experimental probability of an event be a negative number? If ...
Text Solution
|
- Can the experimental probabilty of an event be greater than 1? Justify...
Text Solution
|
- As the number of tosses of a coin increases the ratio of the number of...
Text Solution
|


