Text Solution
Verified by Experts


Topper's Solved these Questions
STATISTICS AND PROBABILITY
NCERT EXEMPLAR ENGLISH|Exercise LONG ASWERS QUESTIONS|14 VideosSTATISTICS AND PROBABILITY
NCERT EXEMPLAR ENGLISH|Exercise VERY SHORT ANSWERS QUESTIONS|14 VideosREAL NUMBERS
NCERT EXEMPLAR ENGLISH|Exercise LONG ANSWER TYPE QUESTIONS|5 VideosSURFACE AREAS AND VOLUMES
NCERT EXEMPLAR ENGLISH|Exercise LONG ANSWER TYPE QUESTIONS|20 Videos
Similar Questions
Explore conceptually related problems
NCERT EXEMPLAR ENGLISH-STATISTICS AND PROBABILITY-SHORT ANSWERS QUESTIONS
- The following table show tha cumulative frequency distribution of mark...
Text Solution
|
- From the frequency distribution table from the following data
Text Solution
|
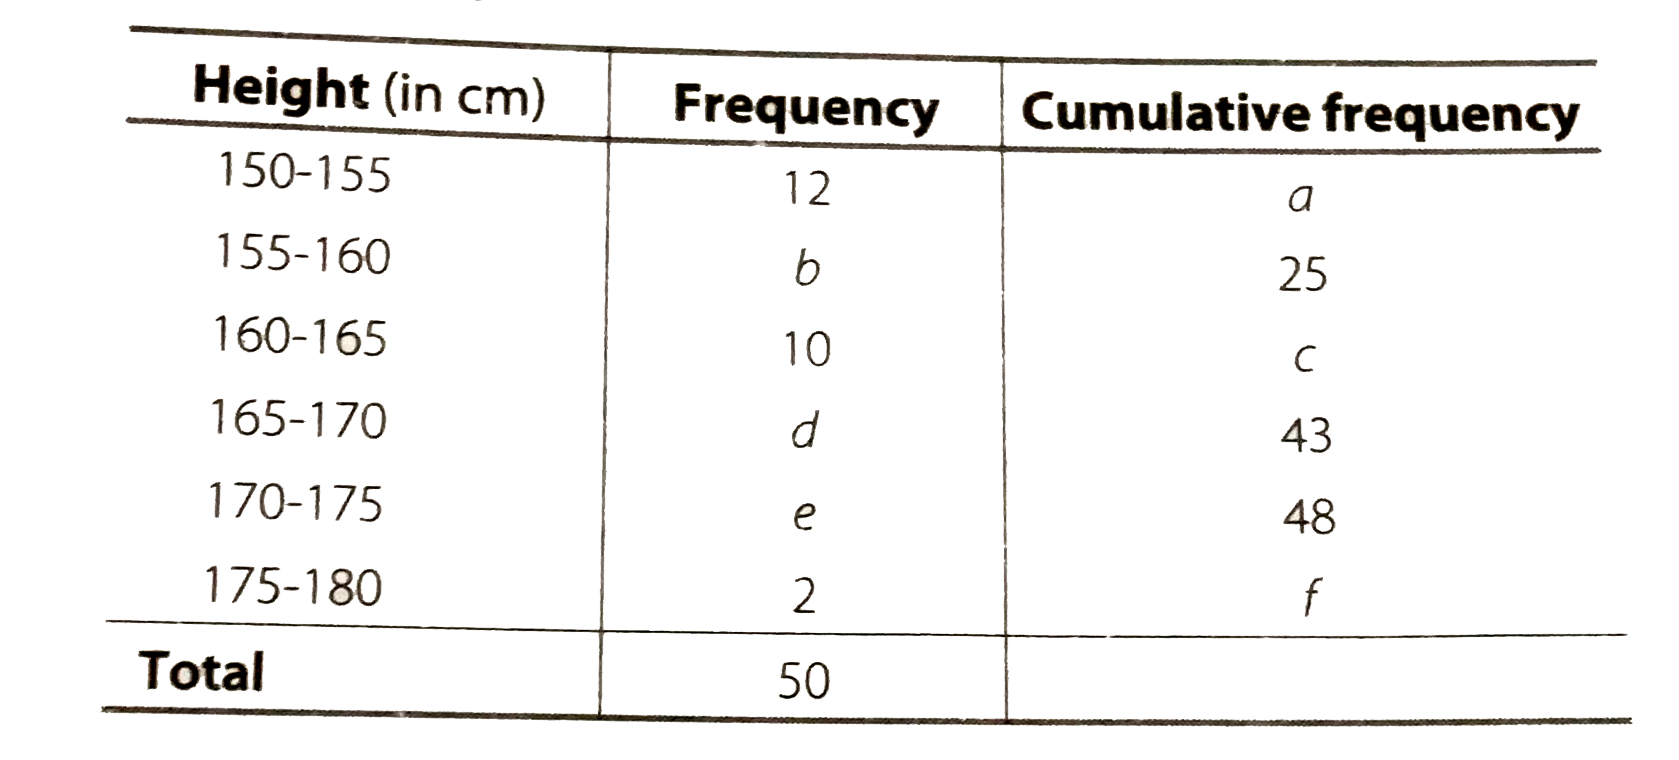
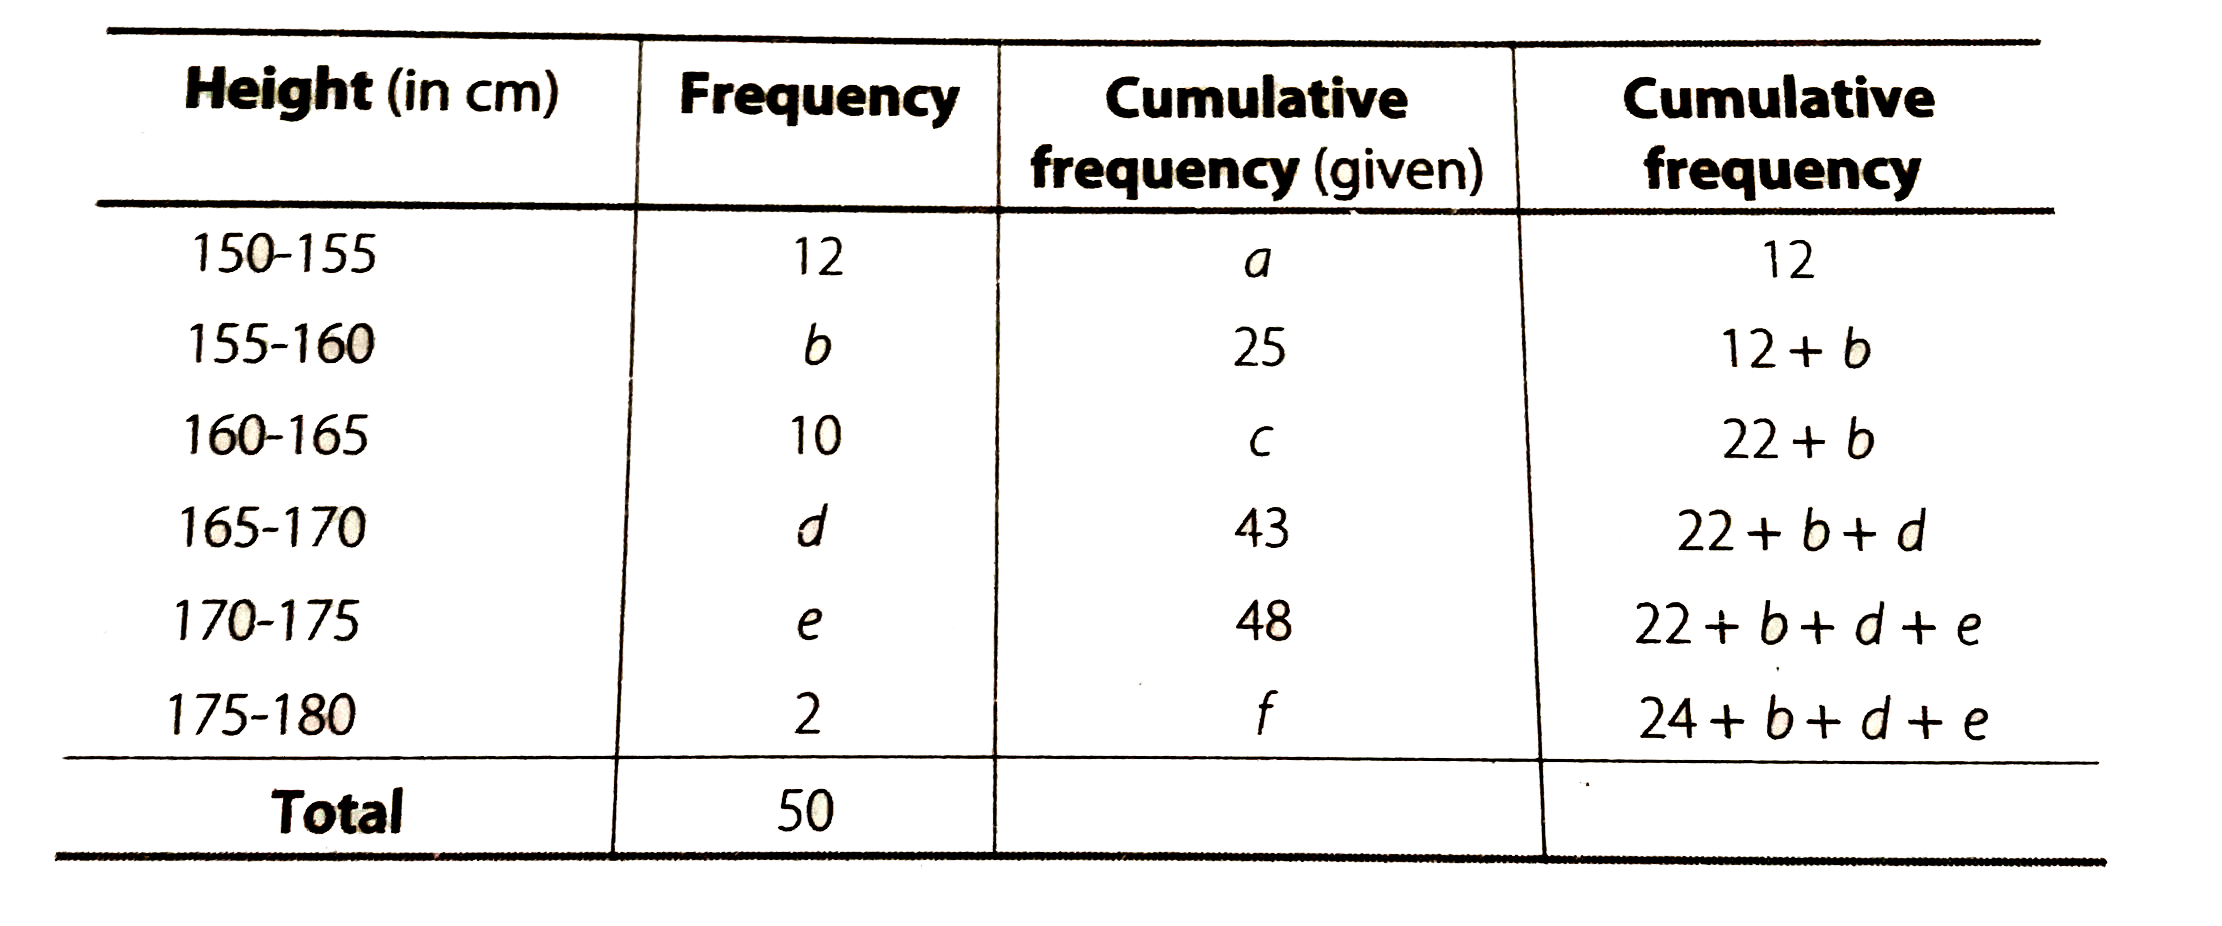
- Find the unknown entries a,b,c,d,e and f in the following distribution...
Text Solution
|
- The following are the ages of 300 patients getting medical treatment i...
Text Solution
|
- Given below is a cumulative frequency distribution showing the mars se...
Text Solution
|
- Weekly income of 600 families is tabulted below. Compute the medi...
Text Solution
|
- The maximum bowling speeds, in km per hour, of 33 players at a cricket...
Text Solution
|
- The monthly income of 100 families are given as below Calculate t...
Text Solution
|
- The weights of coffee im 70 packets are shown in the following table ...
Text Solution
|
- Two dice are thrown at the same time. Find the probability of getting ...
Text Solution
|
- Two dice are thrown simultaneously. What is the probability that the s...
Text Solution
|
- Two dice are thrown together. Find the probability that the product th...
Text Solution
|
- Two dice are thrown at the same time and the product of numbers appear...
Text Solution
|
- Two dice are numbered 1,2,3,4,5,6 and 1,1,2,2,3,3, resepectively. They...
Text Solution
|
- A coin is tossed two times. Find the probability of getting atmost one...
Text Solution
|
- A coin is tossed 3 times. List the possible outcomes. Find the probabi...
Text Solution
|
- Two dice are thrown at the same time. Determine the probability that t...
Text Solution
|
- A bag contains 10 red 5 blue and 7 green balls. A ball is drawn at ran...
Text Solution
|
- The king, queen and jack of clubs are removed from a deck of 52 pla...
Text Solution
|
- Refer to 0.28. What is the probablity that the card is (i) a club (...
Text Solution
|