Text Solution
Verified by Experts


Topper's Solved these Questions
Similar Questions
Explore conceptually related problems
NCERT EXEMPLAR ENGLISH-STATISTICS AND PROBABILITY-LONG ASWERS QUESTIONS
- Find the mean of the students for the following distribution
Text Solution
|
- Determine the mean of the following distribution
Text Solution
|
- Find the mean age of 100 residents of a town from the following data.
Text Solution
|
- The weight of tea in 70 packets are shown in the following table ...
Text Solution
|
- Refer to 0.4 above. Draw the less then type ogive for this data and us...
Text Solution
|
- Refer to 0.5 above. Draw the less then type ogive for this data and us...
Text Solution
|
- The table below shows the salaries of 280 persons. ...
Text Solution
|
- The mean of the following distribution is 50 but the frequency f(1) an...
Text Solution
|
- The median of the following data is 50. Find the values of p and q, if...
Text Solution
|
- The distribution of heights (in cm) of 96 children is given below ...
Text Solution
|
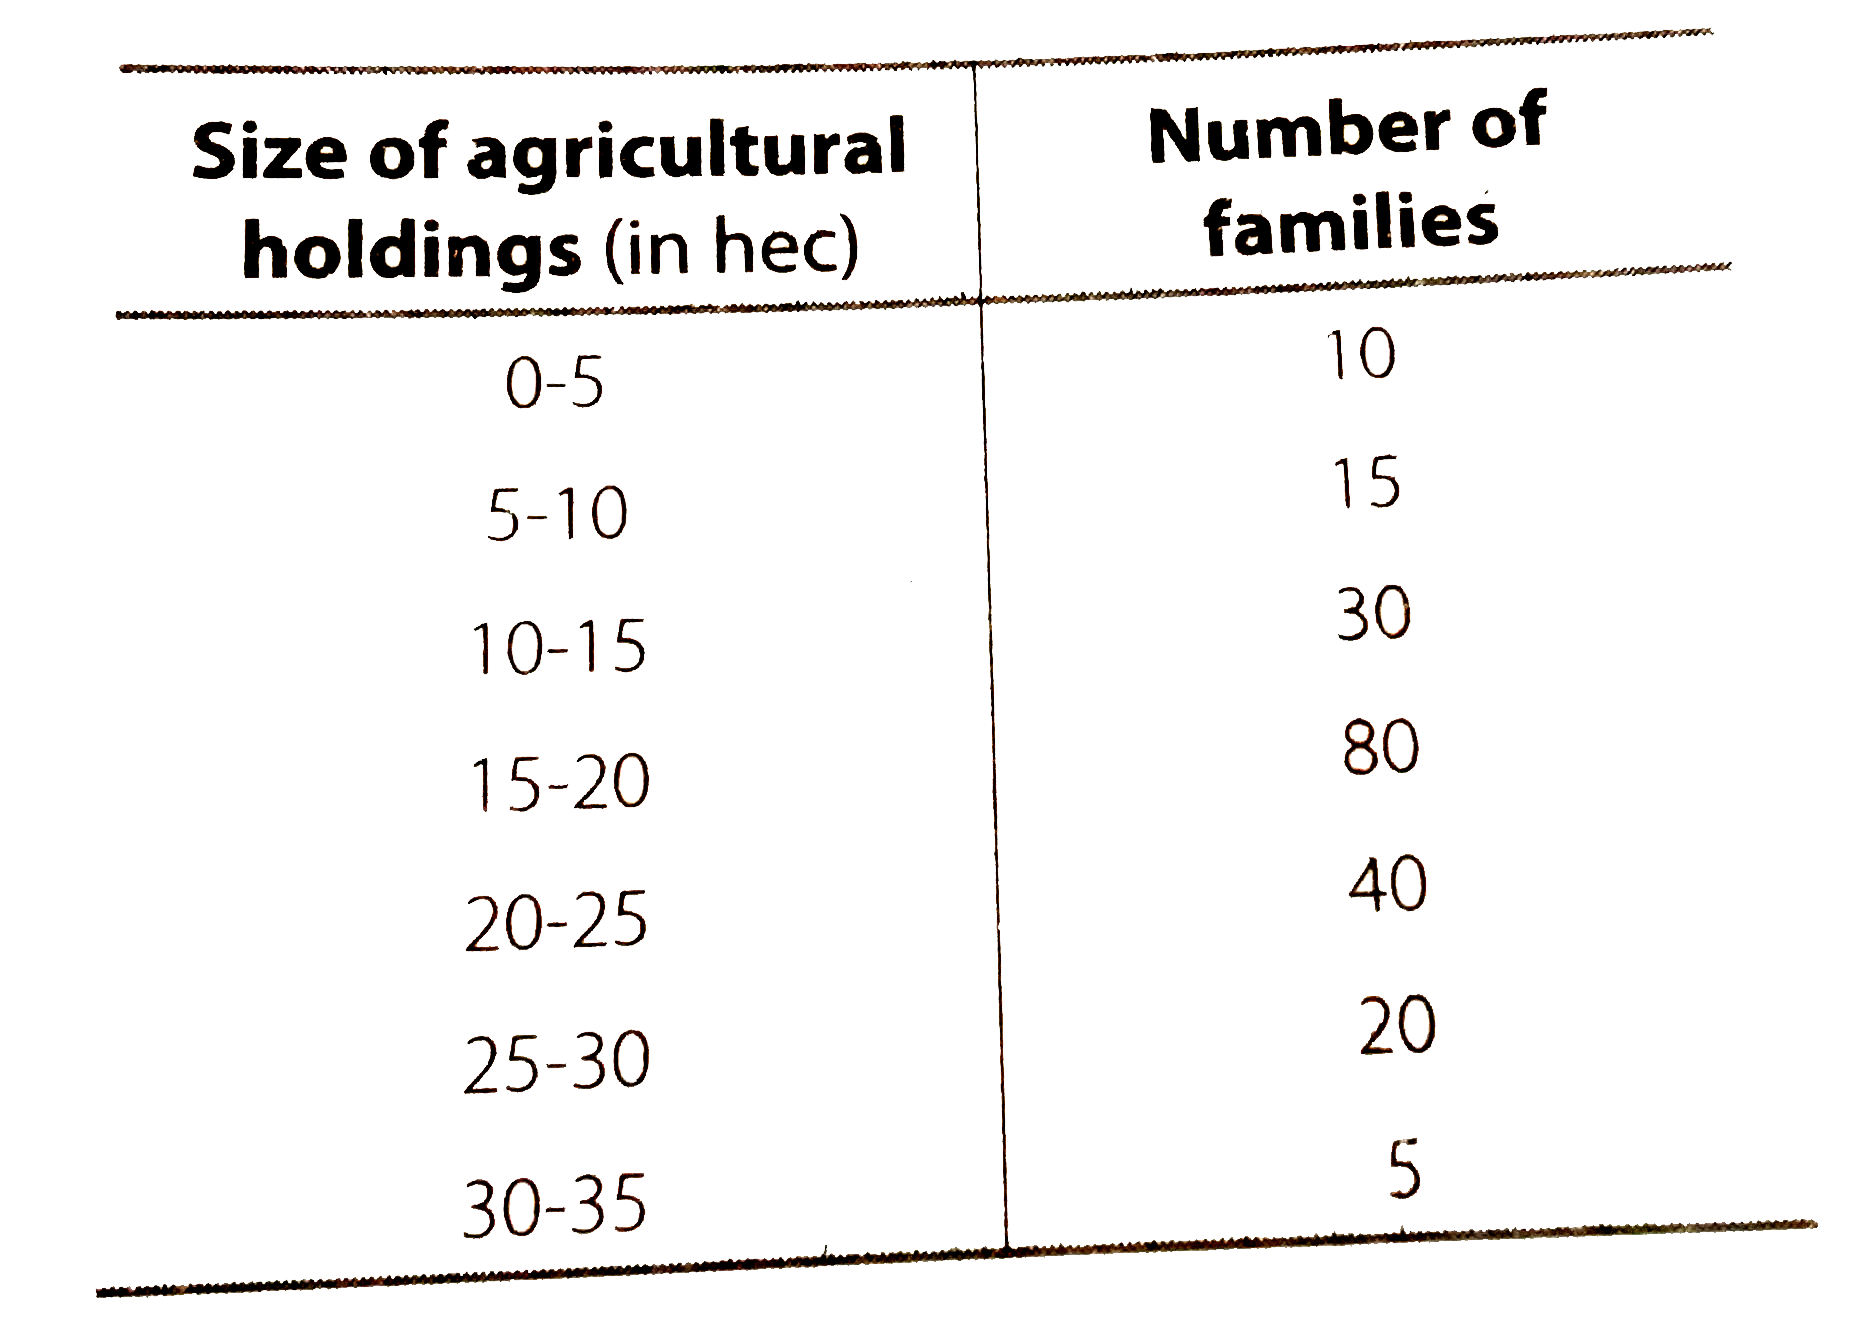
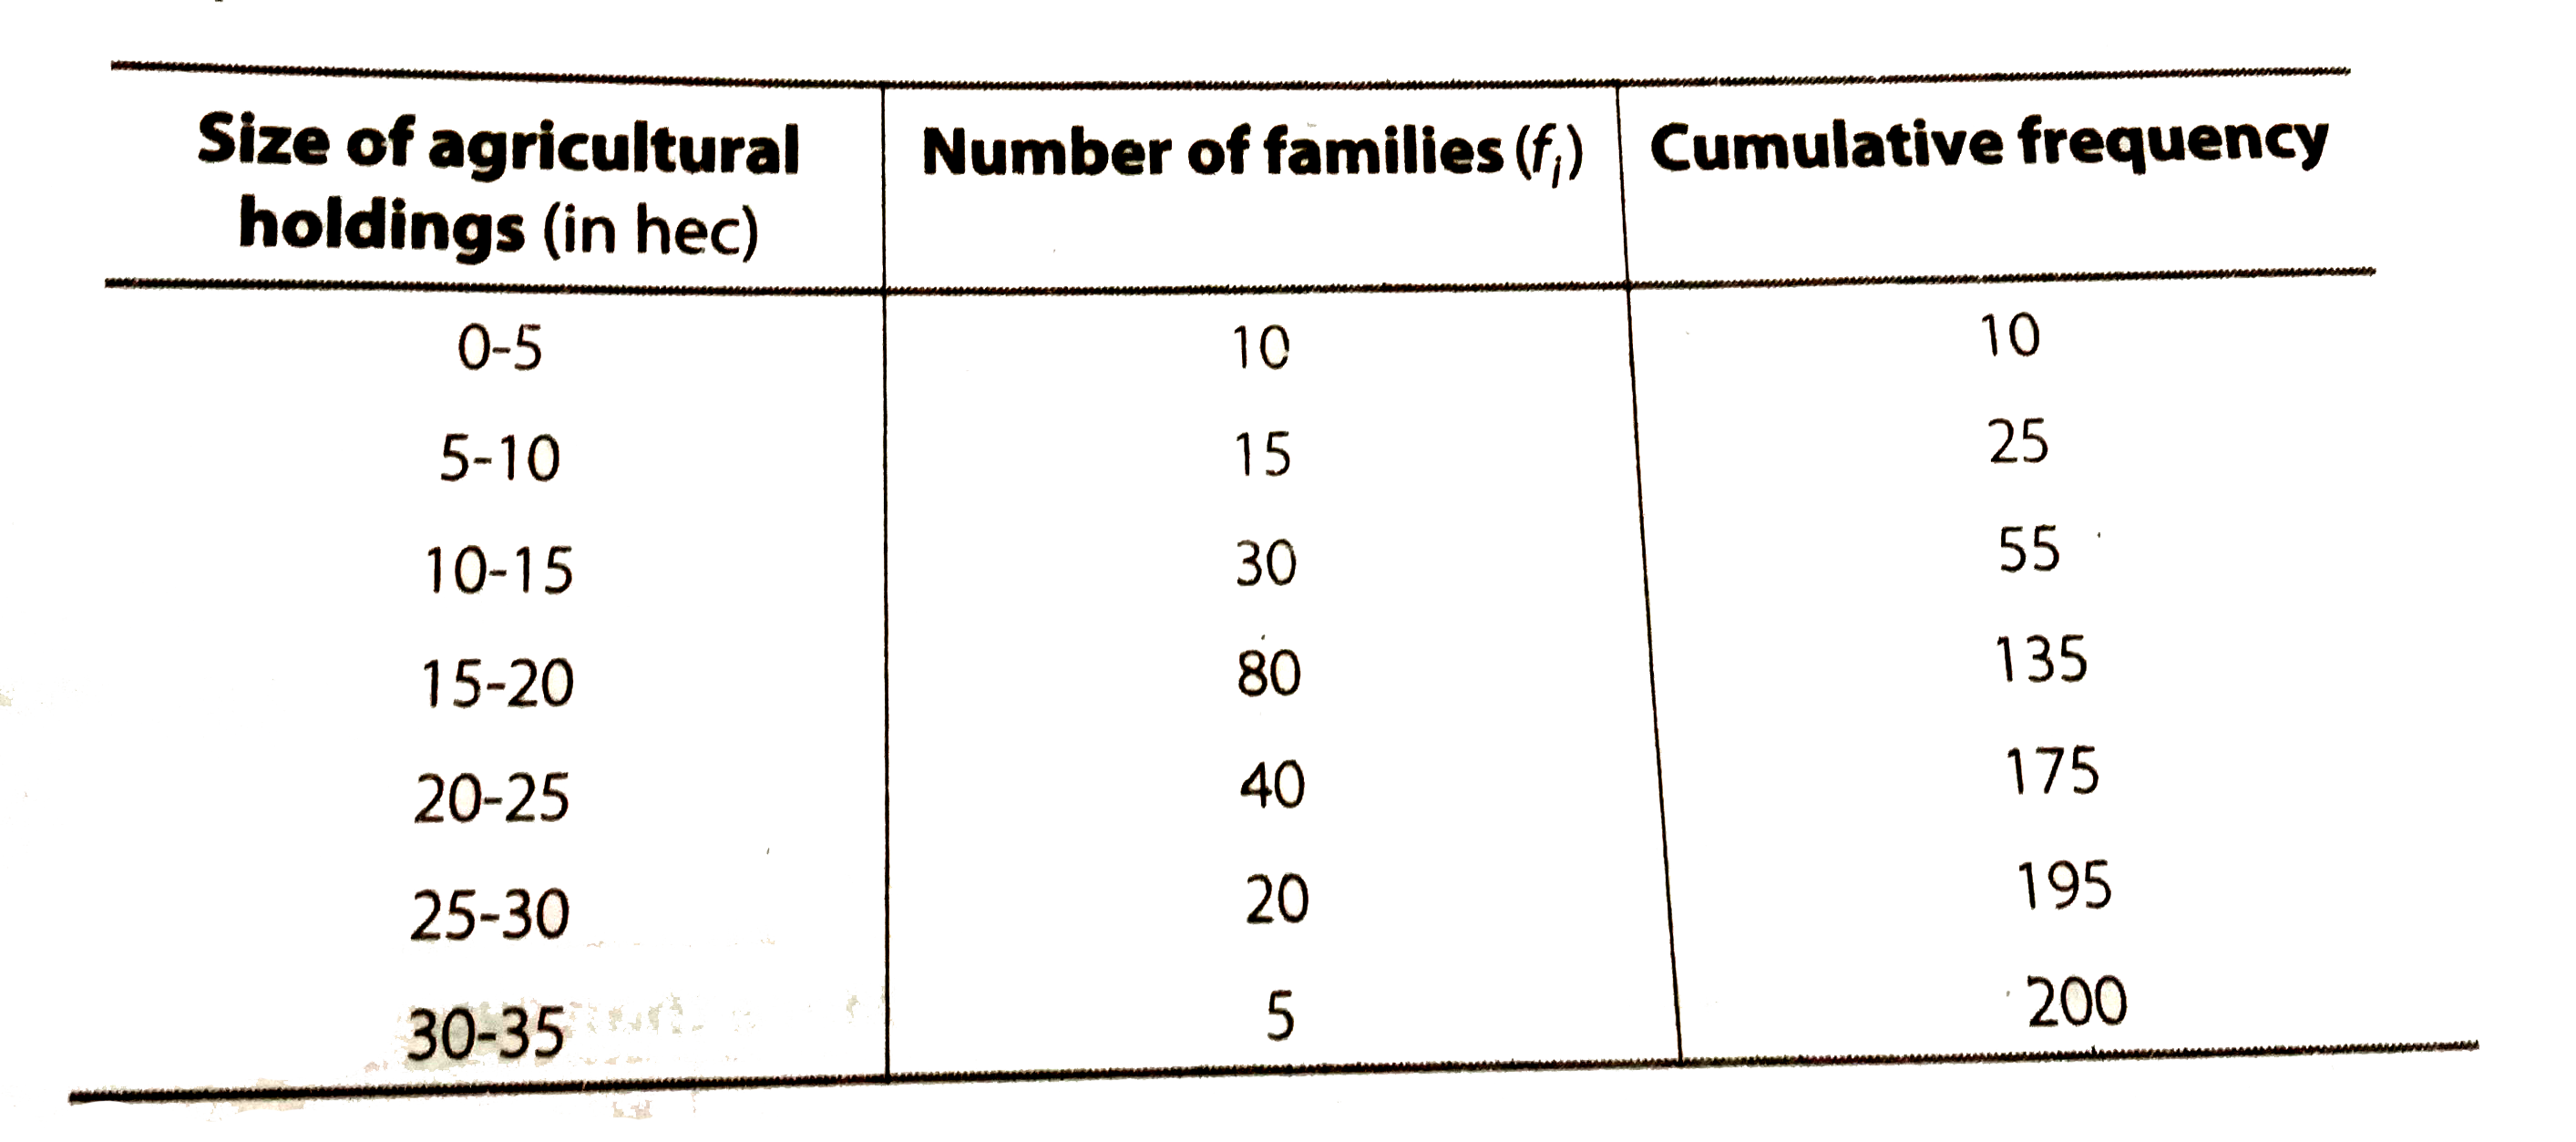
- Size of agricultural holding in a survey of 200 families is given in ...
Text Solution
|
- The annual rainful recored of a city for 66 day is given in the follow...
Text Solution
|
- The following is the frequency distribution of duration for 100 calls ...
Text Solution
|
- 50 students enter for a school javeloin throw competition. The distanc...
Text Solution
|