Text Solution
Verified by Experts


Topper's Solved these Questions
LAWS OF MOTION
NCERT EXEMPLAR ENGLISH|Exercise Short answer type questions|6 VideosLAWS OF MOTION
NCERT EXEMPLAR ENGLISH|Exercise Long answer Type Questions|9 VideosLAWS OF MOTION
NCERT EXEMPLAR ENGLISH|Exercise Mutiple Choice Questions (More than One Options)|6 VideosKINETIC THEORY
NCERT EXEMPLAR ENGLISH|Exercise Multiple Choice Questions (MCQs)|31 VideosMECHANICAL PROPERTIES OF FLUIDS
NCERT EXEMPLAR ENGLISH|Exercise Long Answer Type Questions|3 Videos
Similar Questions
Explore conceptually related problems
NCERT EXEMPLAR ENGLISH-LAWS OF MOTION-Very short answer type Questions
- A girl ridding a bicycle along a straight road with a speed of 5 ms^(-...
Text Solution
|
- A person of mass 50 kg stands on a weighing scale on a lift . If the l...
Text Solution
|
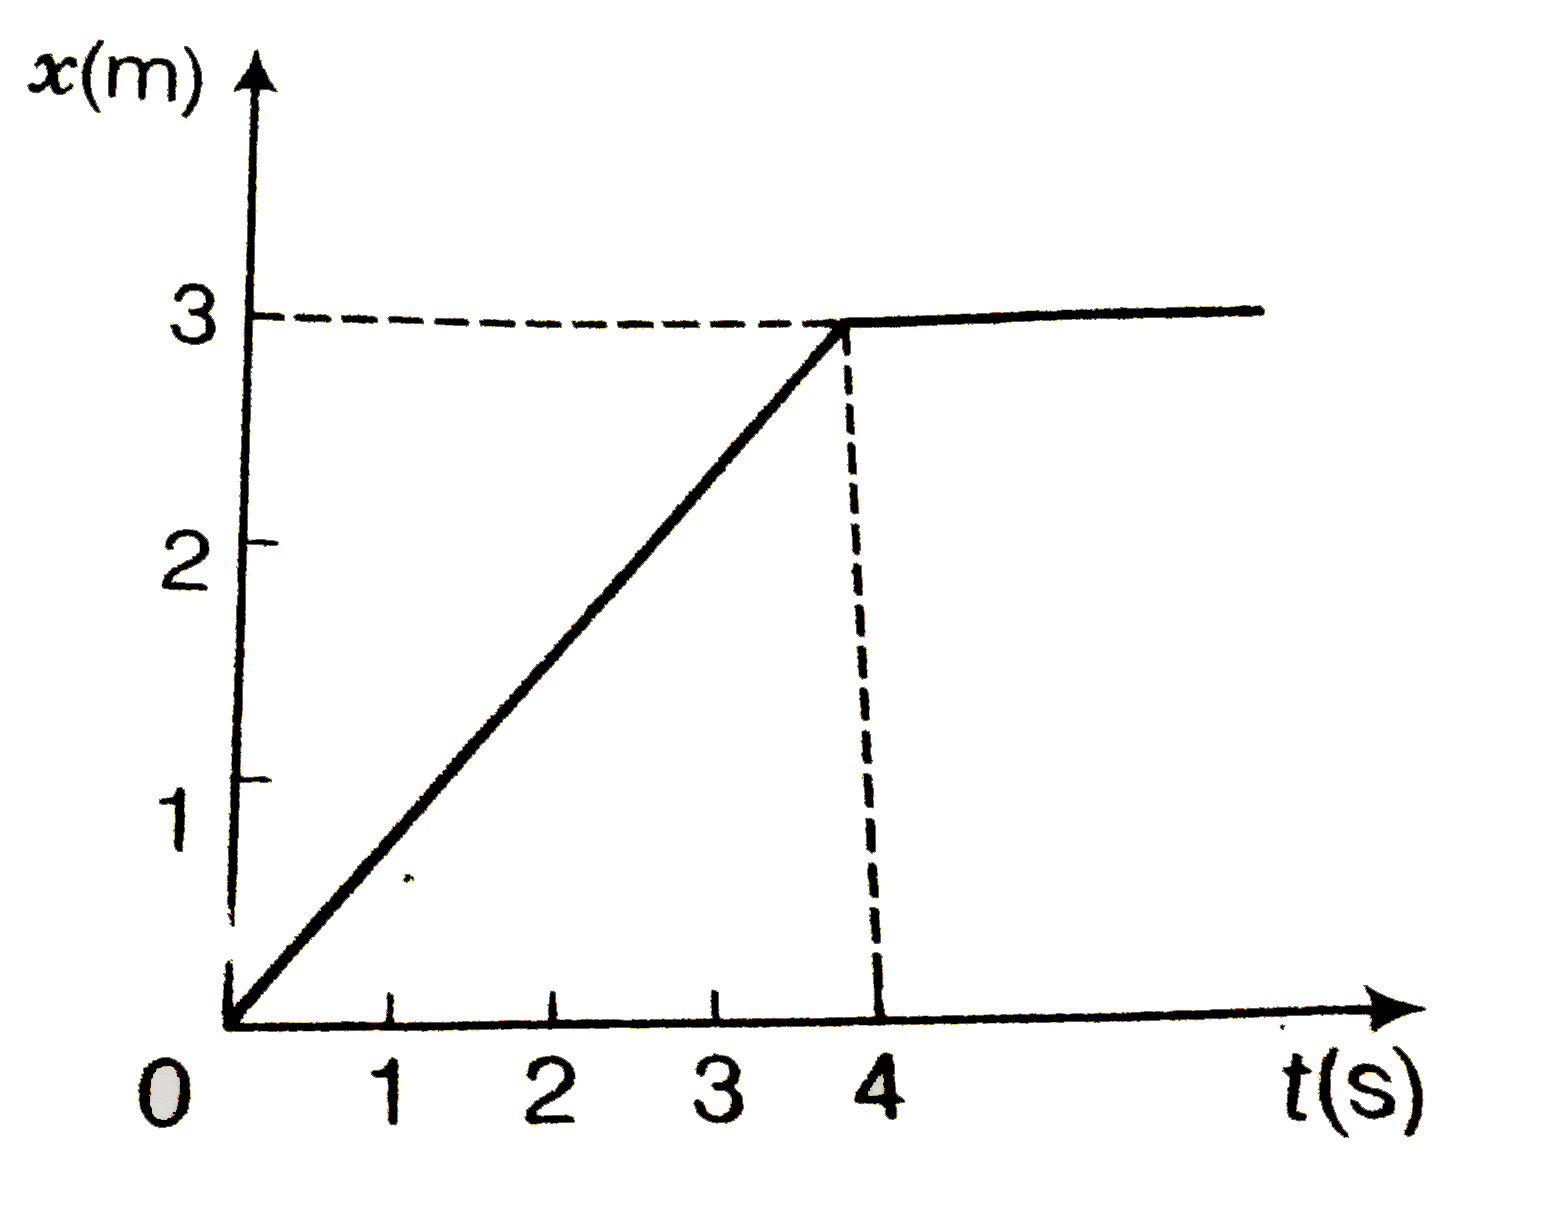
- The position-time graph of a body of mass 2 kg is as given in figure...
Text Solution
|
- A person driving a car suddenly applies the brakes on seeing a child o...
Text Solution
|
- The velocity of a body of mass 2 kg as a function of t is given by ...
Text Solution
|
- A block placed on a rough horizontal surface is pulled by a horizontal...
Text Solution
|
- Why are porcelain objects wrapped in paper or straw before packing for...
Text Solution
|
- Why does a child feel more pain when she falls down on a hard cement f...
Text Solution
|
- A woman throws an object of mass 500 g with a speed of 25 m s^(-1) . ...
Text Solution
|
- Why are mountain roads generally made winding upwards rather than goin...
Text Solution
|
- A mass of 2kg is suspended with thread AB (figure) Thread CD of the sa...
Text Solution
|
- In the above given problem if the lower thread is pulled with a jerk ,...
Text Solution
|