Text Solution
Verified by Experts


Topper's Solved these Questions
ELECTROMAGNETIC INDUCTION
NCERT EXEMPLAR ENGLISH|Exercise Long|11 VideosELECTROMAGNETIC INDUCTION
NCERT EXEMPLAR ENGLISH|Exercise very short answer|6 VideosELECTRIC CHARGES AND FIELD
NCERT EXEMPLAR ENGLISH|Exercise Long Answer Type Question|6 VideosELECTROMAGNETIC WAVES
NCERT EXEMPLAR ENGLISH|Exercise LONG ANSWER|5 Videos
Similar Questions
Explore conceptually related problems
NCERT EXEMPLAR ENGLISH-ELECTROMAGNETIC INDUCTION -Short answer type questions
- A magnetic field in a certain region is given by B = B(0) cos (omega t...
Text Solution
|
- Consider a closed loop C in a magnetic field, Fig. The flux passing th...
Text Solution
|
- Find the current in the wire PQ for the configuration shown in Fig.Wir...
Text Solution
|
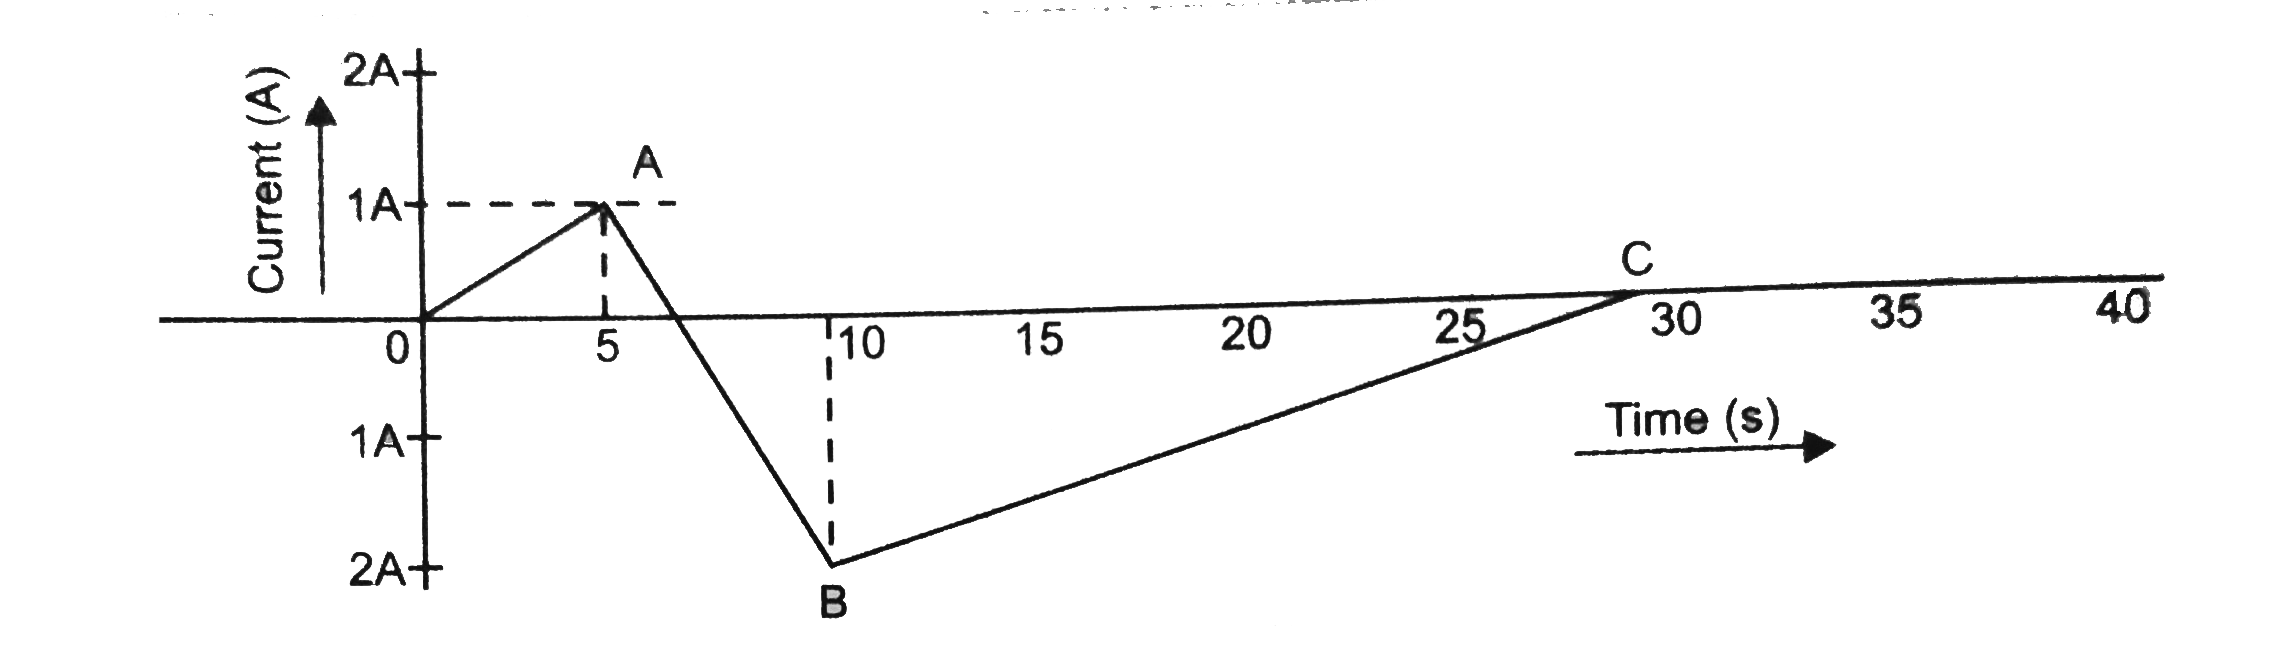
- A (current vs time) graph of the current passing through a solenoid is...
Text Solution
|
- There are two coils A and B seperated by some distance. If a current o...
Text Solution
|