A
B
C
D
Text Solution
Verified by Experts
The correct Answer is:


Topper's Solved these Questions
CHEMICAL KINETICS
NCERT EXEMPLAR ENGLISH|Exercise MULTIPLE CHOICE QUESTIONS|12 VideosCHEMICAL KINETICS
NCERT EXEMPLAR ENGLISH|Exercise SHORT ANSWER TYPE QUESTION|20 VideosBIOMOLECULES
NCERT EXEMPLAR ENGLISH|Exercise Long Answer Type Questions|5 VideosCHEMISTRY IN EVERYDAY LIFE
NCERT EXEMPLAR ENGLISH|Exercise Long Answer Type Qns|4 Videos
Similar Questions
Explore conceptually related problems
NCERT EXEMPLAR ENGLISH-CHEMICAL KINETICS-LONG ANSWER TYPE QUESTIONS
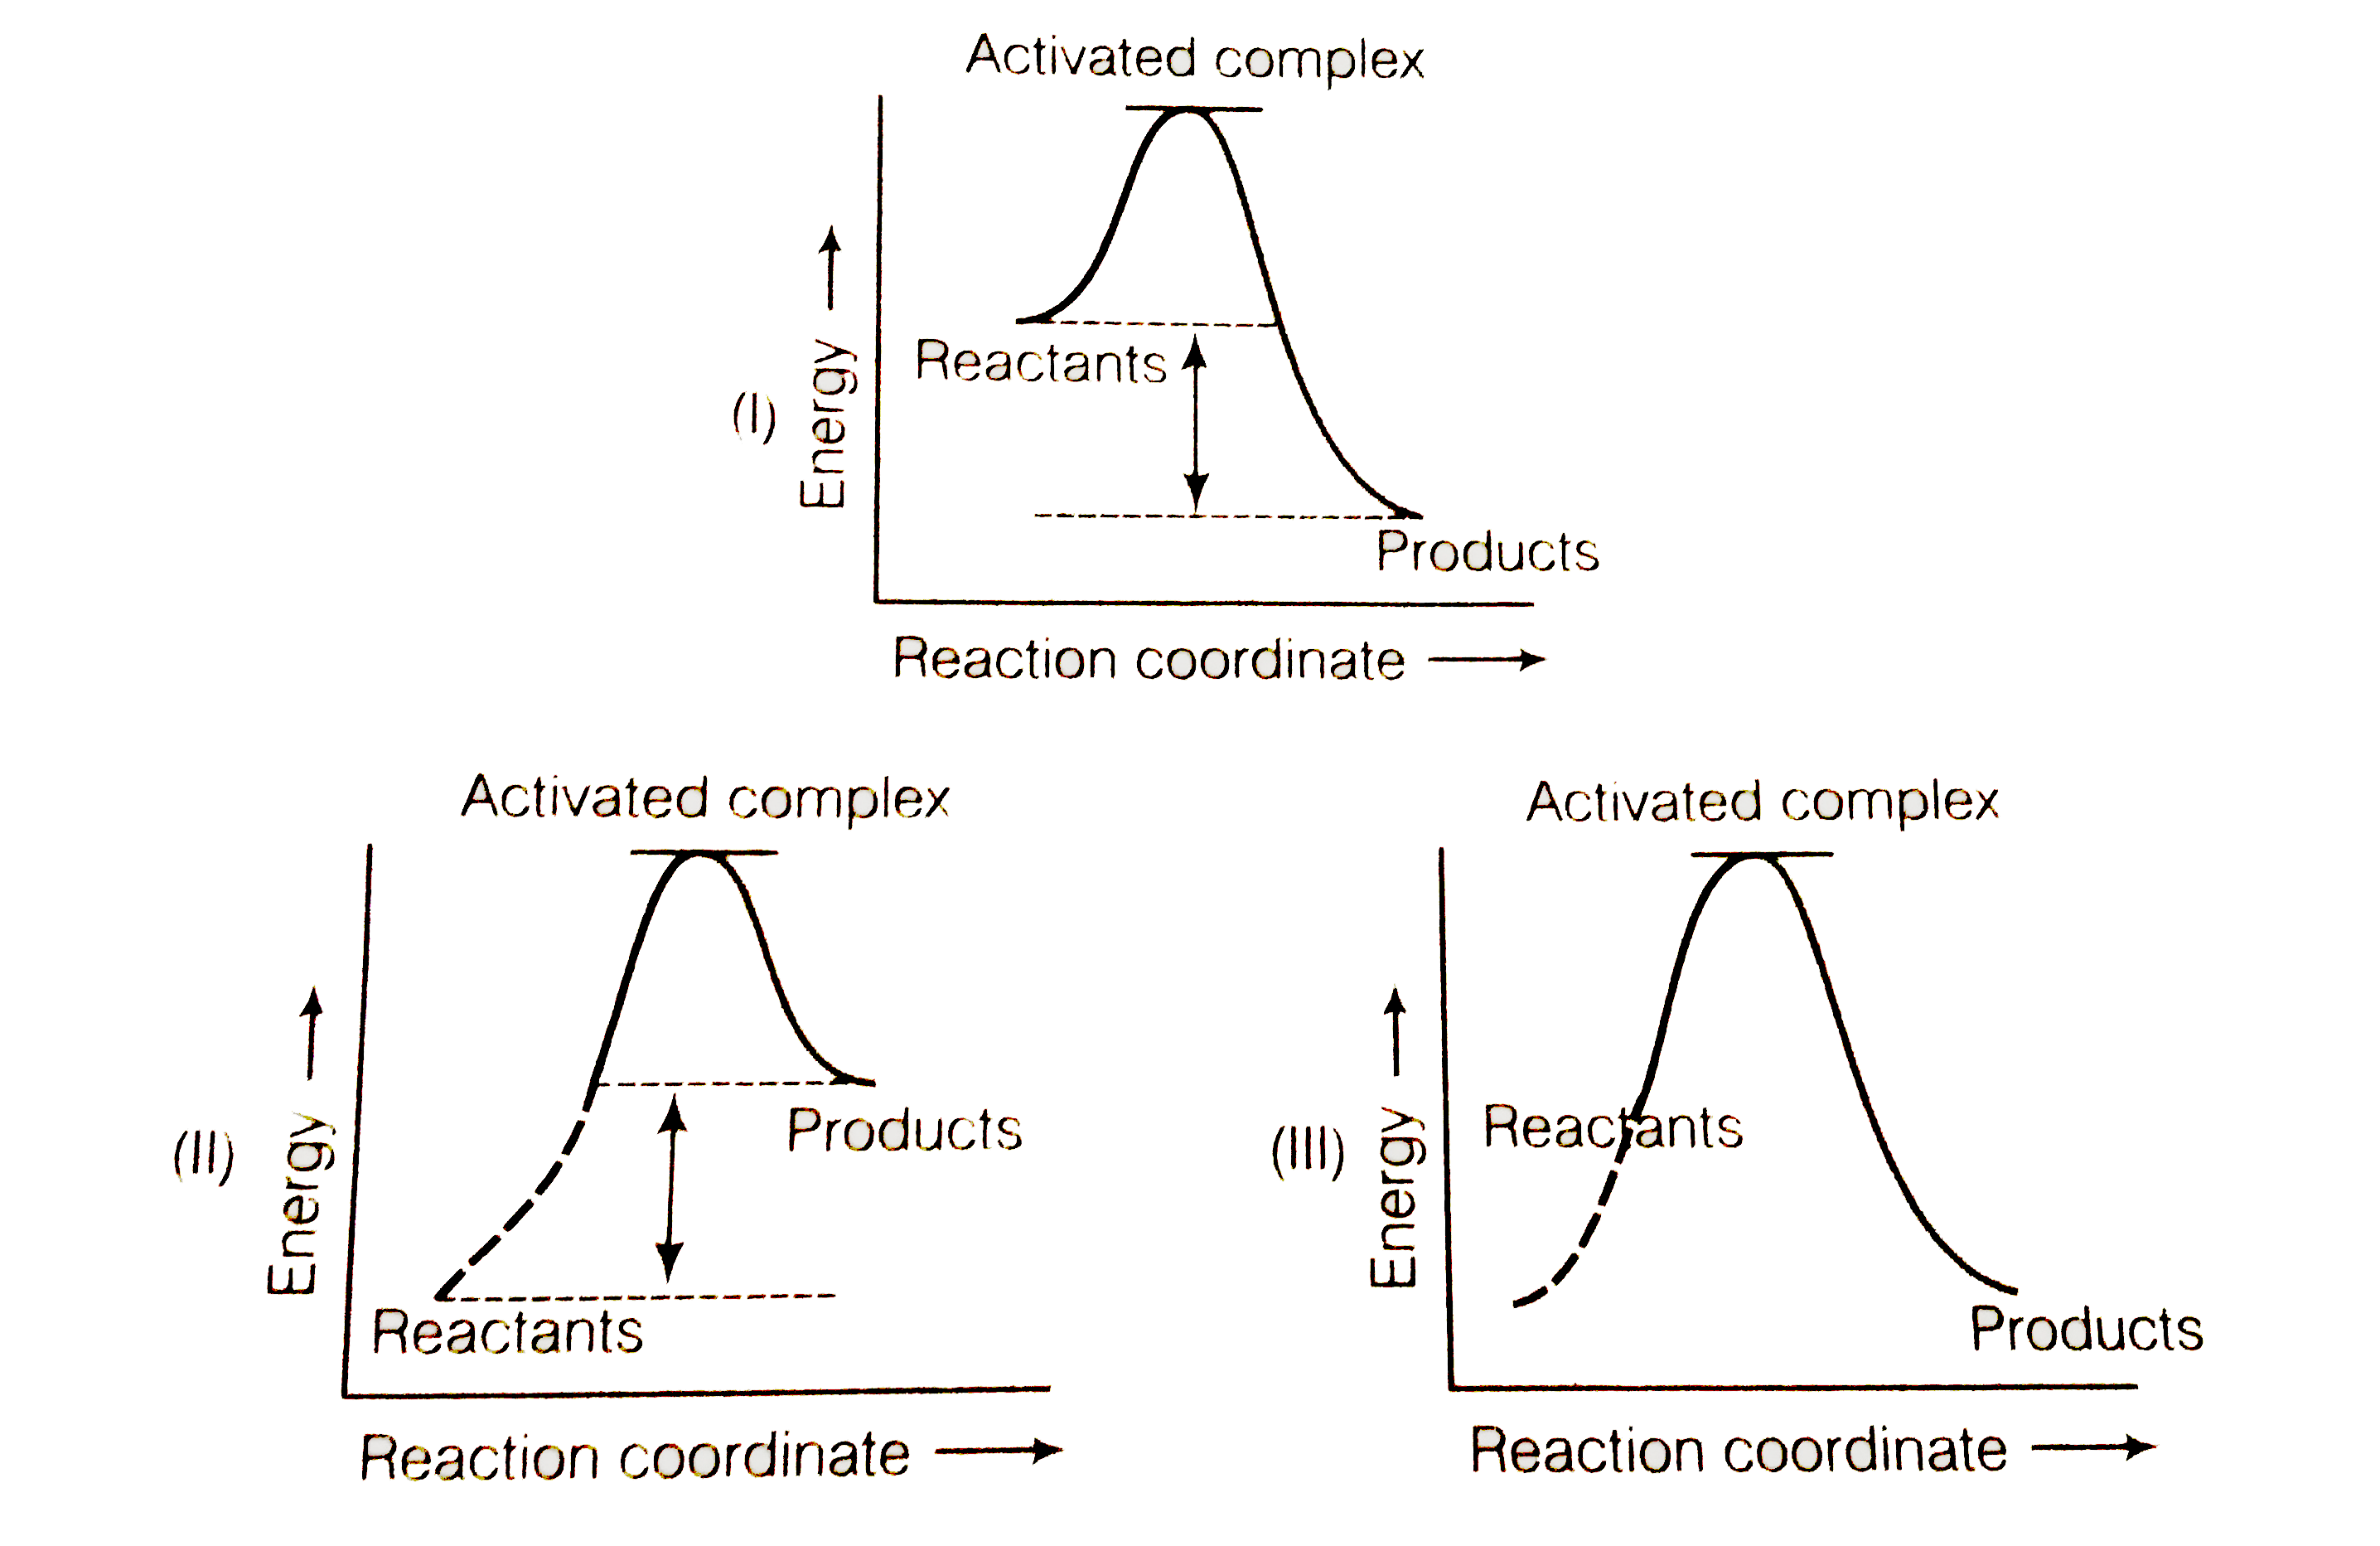
- Which of the following graph represents exothermic reaction ?
Text Solution
|
- All energetically effective collisions do not result in a chemical ...
Text Solution
|
- What happes to most probable to the absolute temperatur and the en...
Text Solution
|
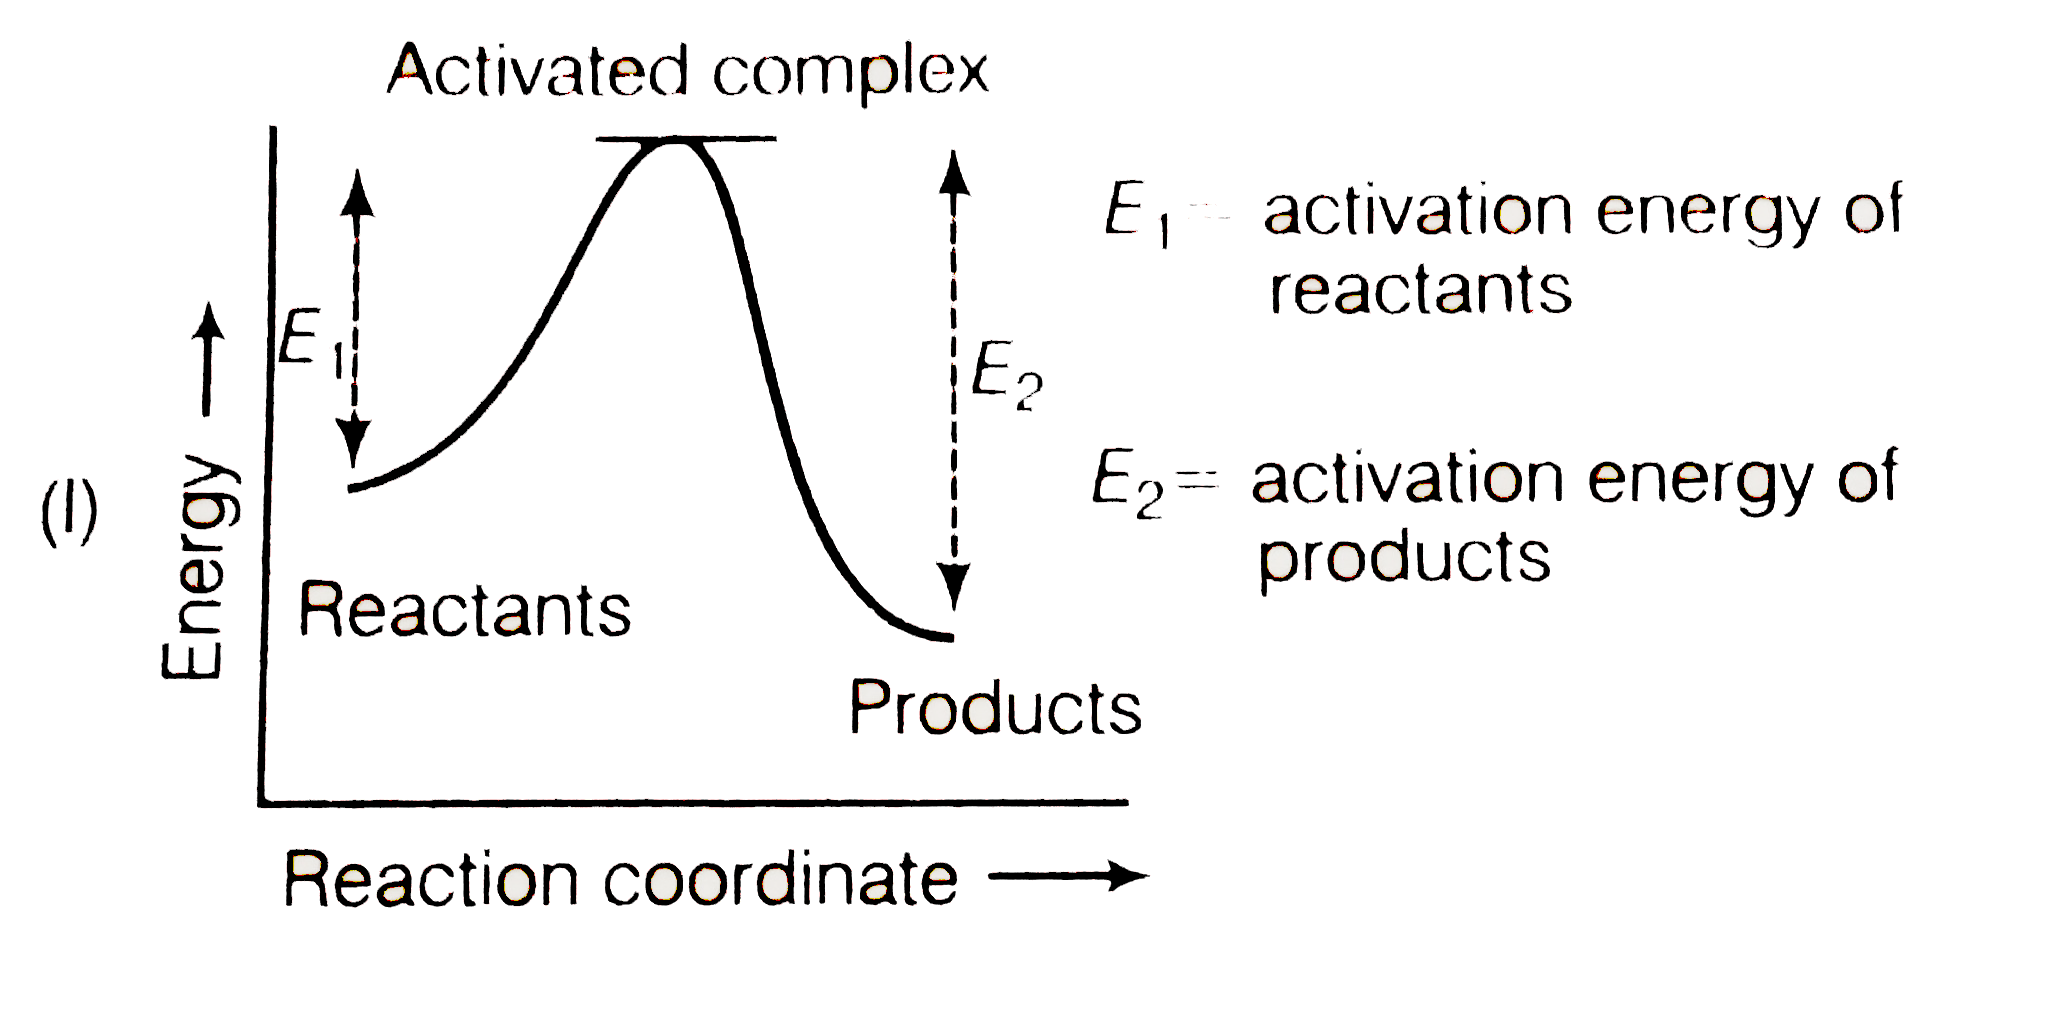
- Describe how does the enthalpy of reaction remain unchanged when a cat...
Text Solution
|
- Explain the difference between instantaneous rate of a reaction and ...
Text Solution
|
- With the help of an example explain what is meant by pseudo first or...
Text Solution
|