


Similar Questions
Explore conceptually related problems
Recommended Questions
- The following curve is obtained when molar conductivity (wedge(m)) is ...
Text Solution
|
- Statement: For a weak electrolyte, the plot of molar conductivity (Lam...
Text Solution
|
- The curves obtained when molar conductivity lambda(m) (along Y-axis) i...
Text Solution
|
- Molar conductivity of an electrolyte is the conductance of all the ion...
Text Solution
|
- The following curve is obtained when molar conductivity (wedge(m)) is ...
Text Solution
|
- Molar conductance of electrolytic solution wedge(m) is
Text Solution
|
- आप वैद्युत-अपघट्य (electrolyte) व वैद्युत -अनअपघट्य को मोलर चालकता द्व...
Text Solution
|
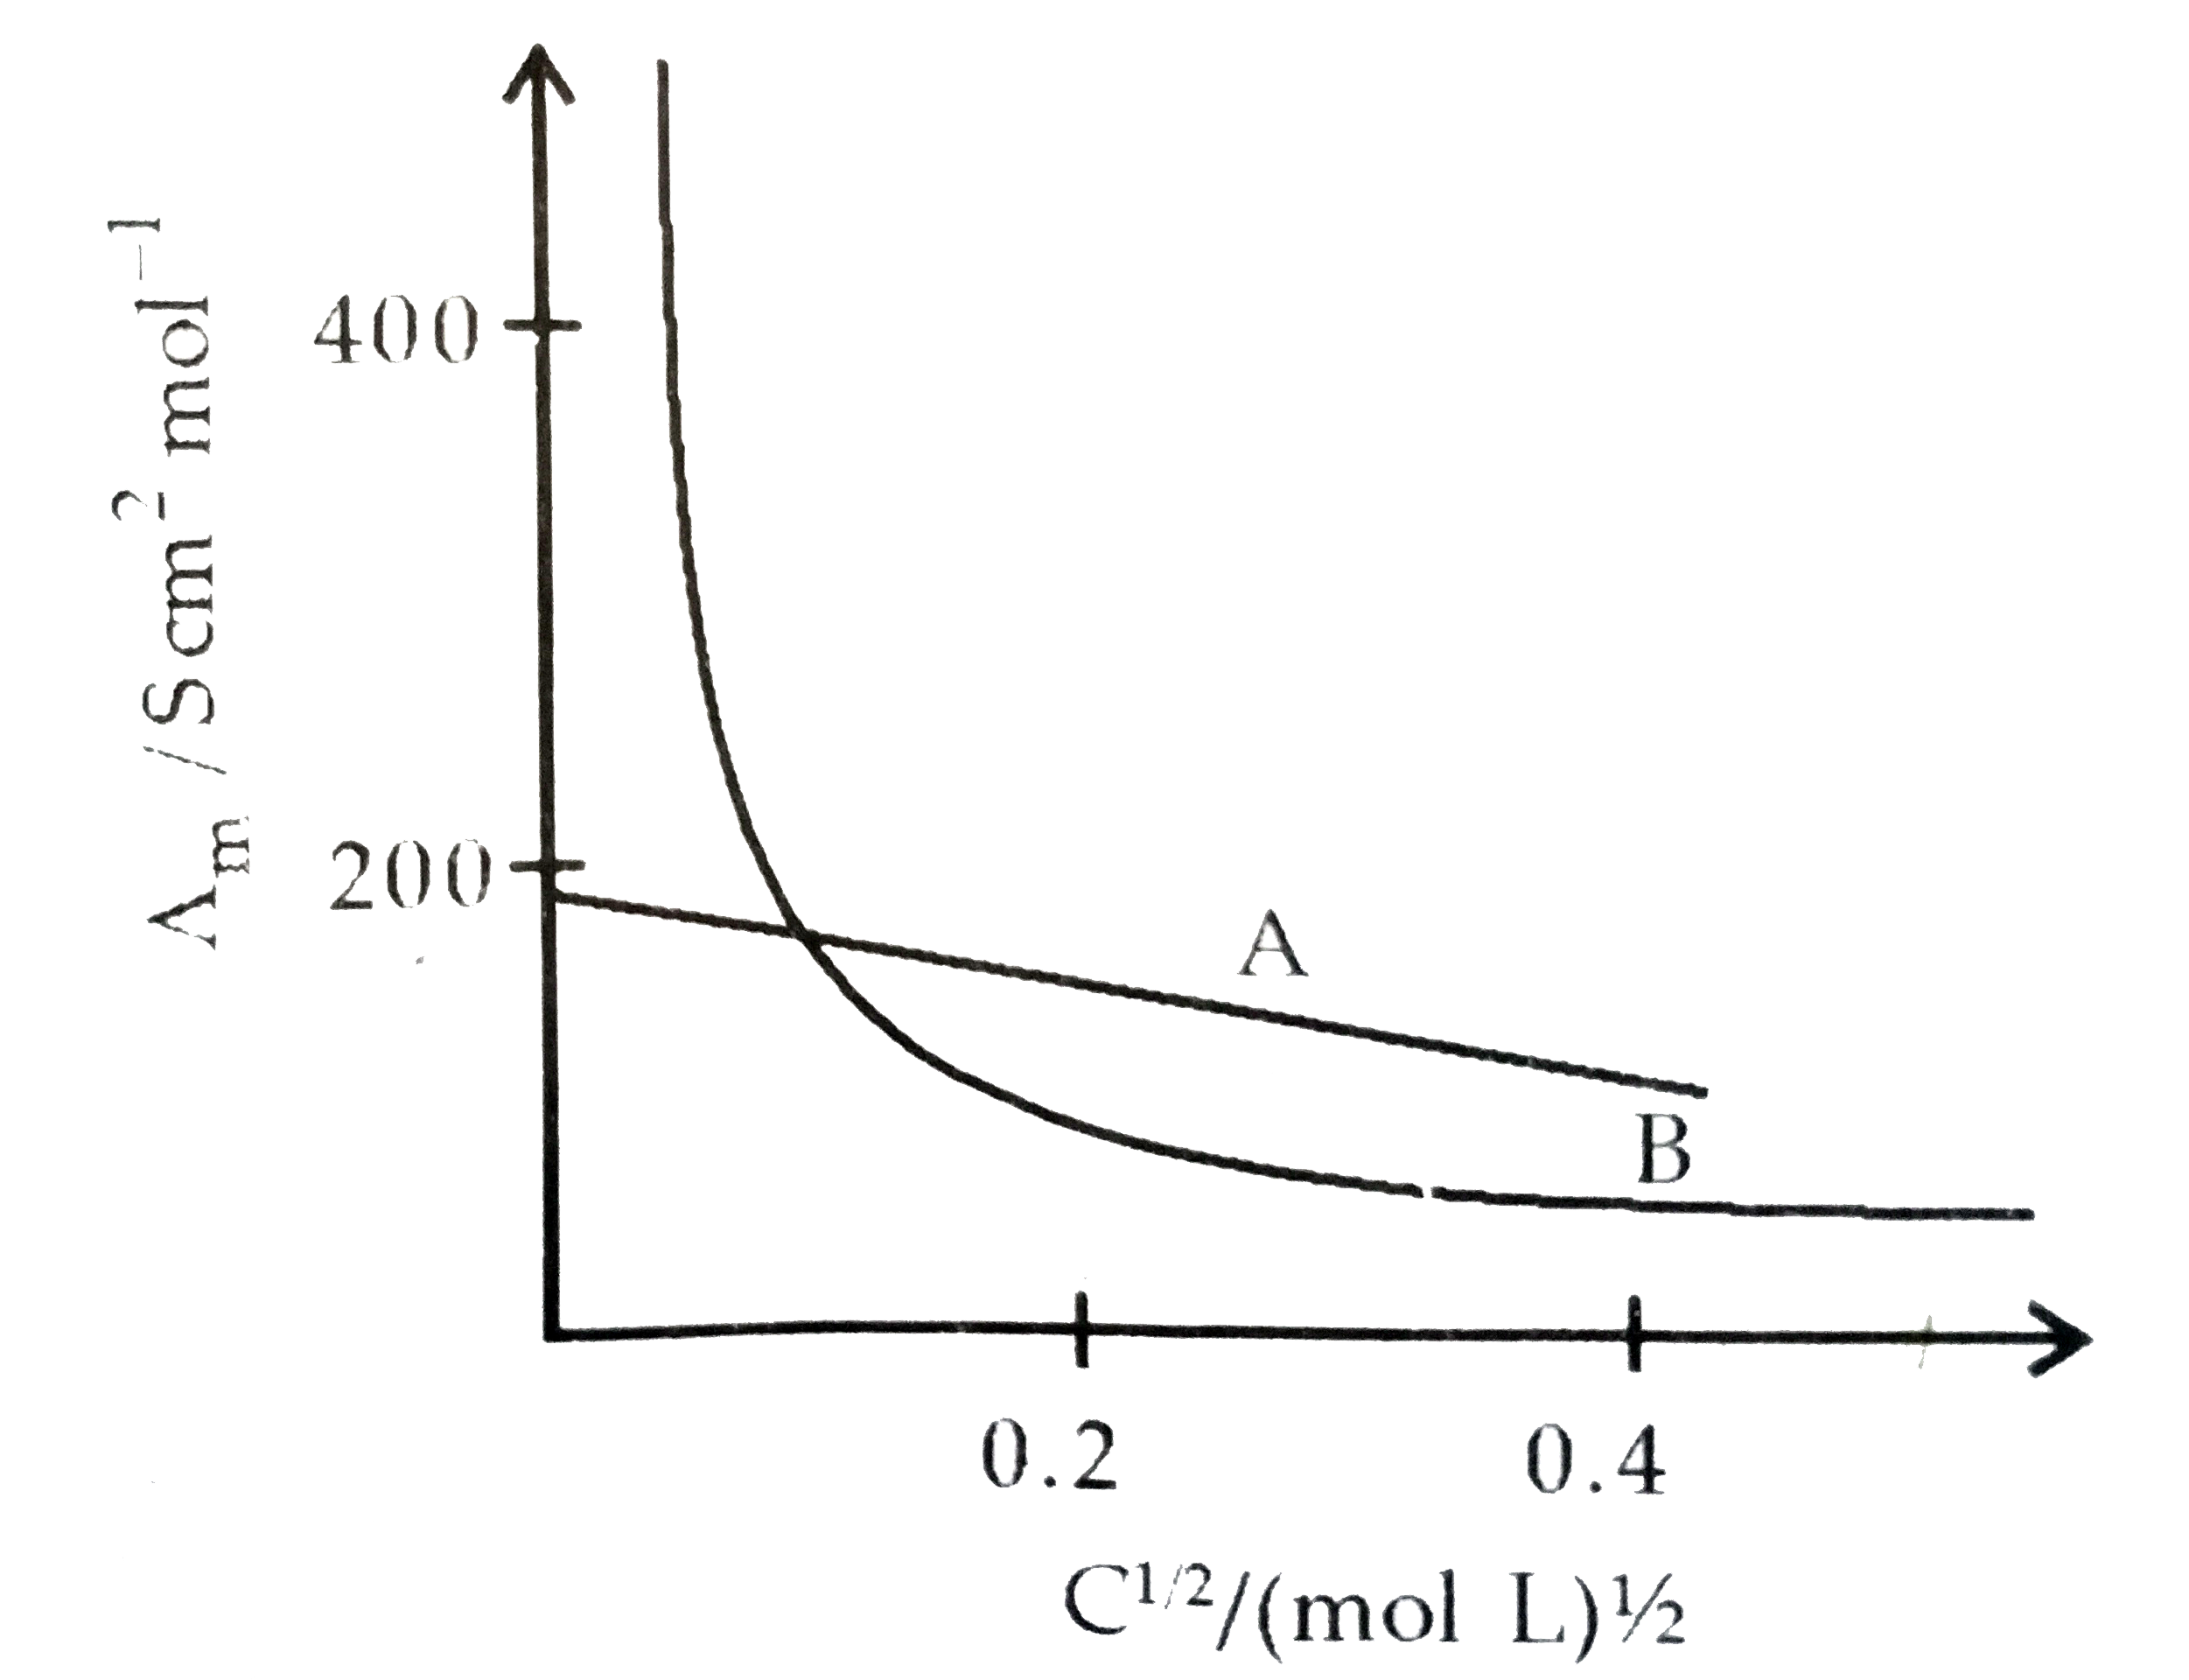
- In the plot of molar conductivity (^ m) vs square root of concentratio...
Text Solution
|
- Assertion : For a strong electrolyte, higher the concentration, lower ...
Text Solution
|