


Recommended Questions
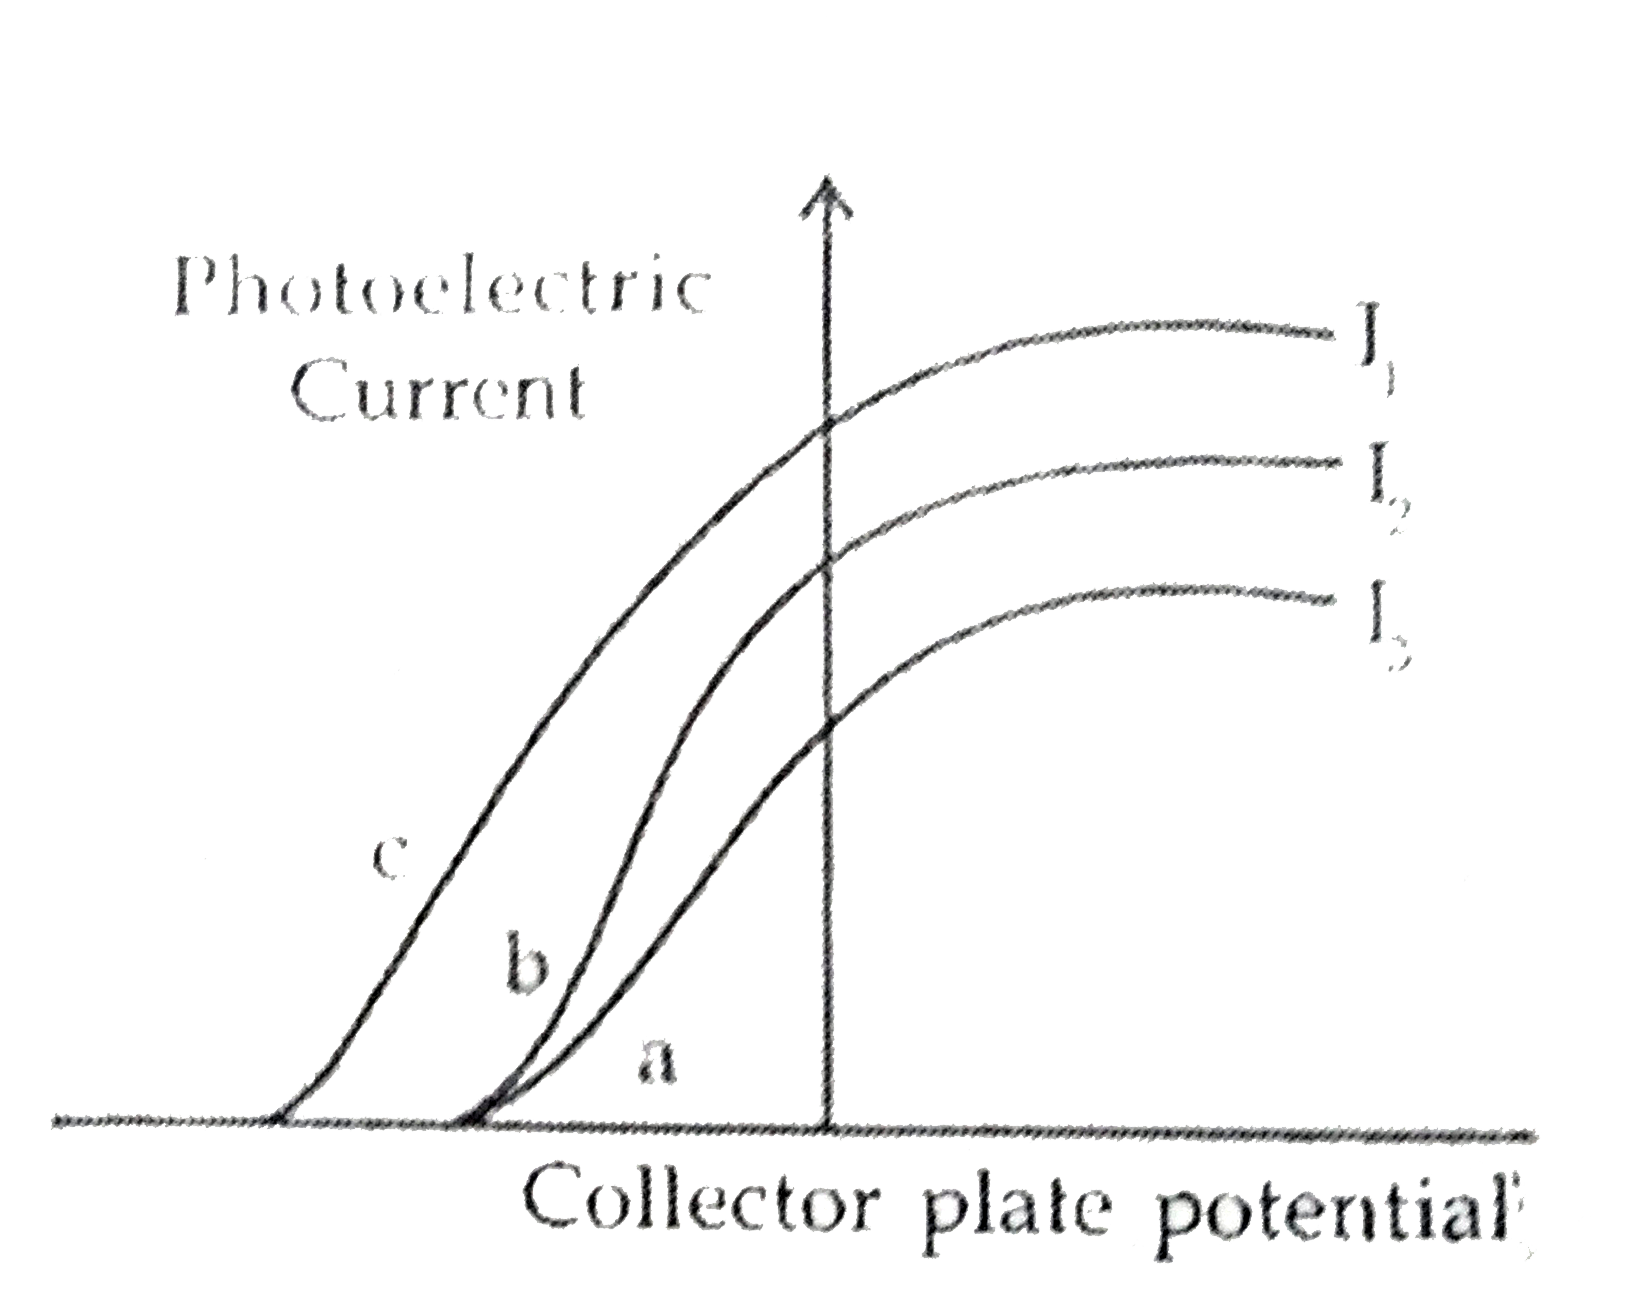
- The figure shows a plot of three curves a, b, c, showing variation of ...
Text Solution
|
- The curves (a) , (b) , ( c ) and (d) show the variation between the ap...
Text Solution
|
- The Fig shows a plot of three curves a, b, c showing the variation of ...
Text Solution
|
- A photoelectric experiment is performed at two different light intensi...
Text Solution
|
- Plota graph showing the variation of photo current vs collector potent...
Text Solution
|
- चित्र में संग्राहक विभव एवं प्रकाश वैधुत धारा के मध्य तीन वक्र ...
Text Solution
|
- किसी कमानी की I(1),I(2) तथा I(3) लम्बाई के तीन भागों में विभाजित करने ...
Text Solution
|
- If v(1) and v(2) are the velocities of light in the two media having a...
Text Solution
|
- Fig. shows variation of photocurrent with anode potential for photosen...
Text Solution
|