


Similar Questions
Explore conceptually related problems
Recommended Questions
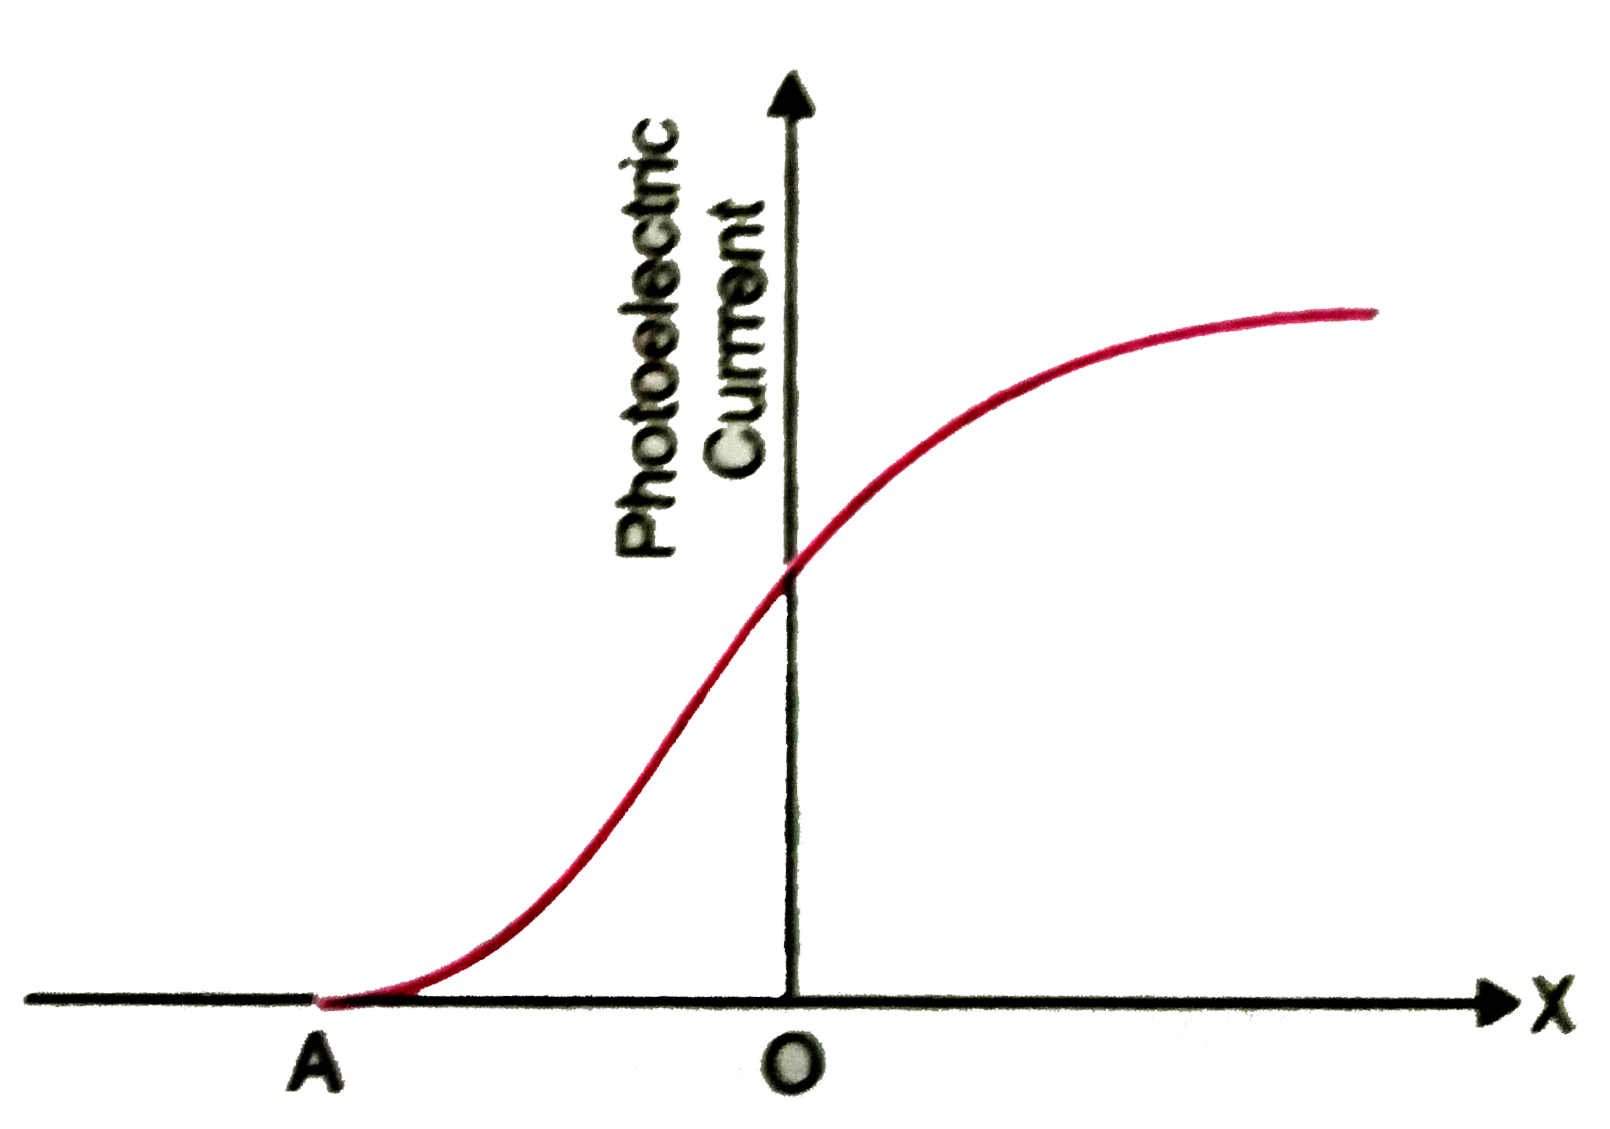
- The following graph shows the variation of photoelectric current for a...
Text Solution
|
- The graph of Fig. shows the variation of photoelectric current (I) ver...
Text Solution
|
- Plot a graph showing the variation of photoelectric current with anode...
Text Solution
|
- The following graph shows the variation of photoelectric current for a...
Text Solution
|
- Which one of the following graphs in figure shows the variation of pho...
Text Solution
|
- Draw graphs showing variation of photoelectric current with applied vo...
Text Solution
|
- Draw a plot showing the variation of photoelectric current versus the ...
Text Solution
|
- The given graph shows the variation of velocity (v) with position (x) ...
Text Solution
|
- Define photoelectric effect. Draw a graph to show the variation of sto...
Text Solution
|