


CENGAGE ENGLISH-GRAPHICAL TRANSFORMATIONS-ILLUSTRATION
- Plot y=sinxa n dy=sin2xdot
Text Solution
|
- If nsinx=log(e)x has exactly 1 root, then find the possible value of n...
Text Solution
|
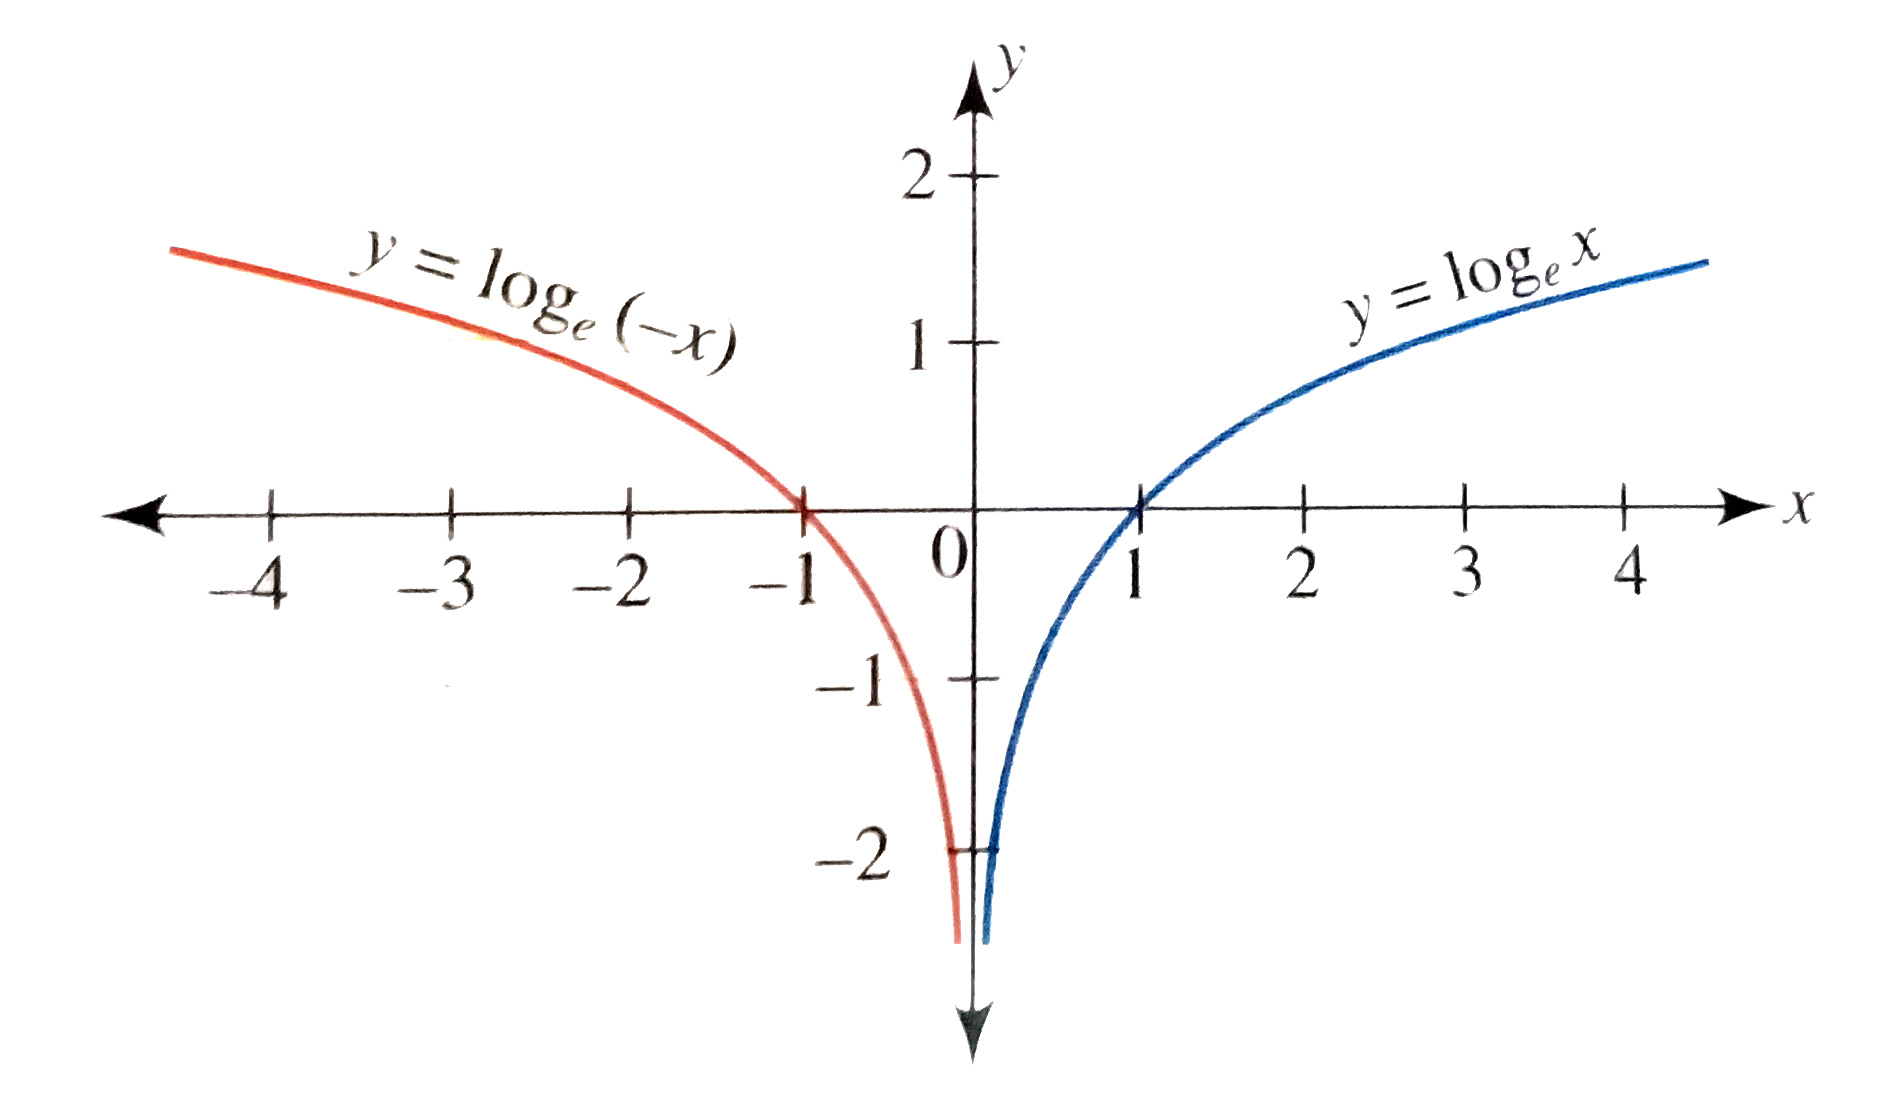
- Plot the curve y=(log)e(-x)dot
Text Solution
|
- Draw the graph of y=2^(-x).
Text Solution
|
- Draw the graph of y=cot^(-1)(-x).
Text Solution
|
- Draw the graph of y=-cot^(-1)x.
Text Solution
|
- Draw the graph of y=-log(e)x.
Text Solution
|
- Draw the graph of y=2-|x-1|.
Text Solution
|
- Draw the graph of y=sin^(-1)(cosx).
Text Solution
|
- Given the graph of y=f(x). Draw the graphs of the followin. (a)...
Text Solution
|
- Draw the graph of y=|logx|.
Text Solution
|
- Draw the graph of y=|sinx| and hence the graph of y=sin^(-1)|sinx|.
Text Solution
|
- Draw the graph of y=f(x)=sqrt(1-cosx)
Text Solution
|
- Drew the graph of y=|sinx-0.5|.
Text Solution
|
- The number of solution of 2cosx=|sinx| where x in [0.4pi] is/are
Text Solution
|
- Solve |x^2+4x+3|+2x+5=0.
Text Solution
|
- Solve cos2xgt|sinx|,x in(-(pi)/(2),pi)
Text Solution
|
- Prove that the equation 2 sin x=|x|+a has no solution for a in ((3sqrt...
Text Solution
|
- Solve |x^(2)-1|+|x^(2)-4|lt6 graphically.
Text Solution
|
- Discuss the differentiability of f(x)=mim.{|x|,|x-2|,2-|x-1|}.
Text Solution
|