Home
Class 12
MATHS
The graph of f is shown. State, with rea...

The graph of f is shown. State, with reason, the numbers at which f is not differentiable.

Text Solution

Verified by Experts

At x =- 4, f is discontinuous, hence non-differentiable.
At x =- 1, f is continuous but has corner, hence non-differentiable.
At x = 2, f has vertical asymptote, hence non-differentiable.
At x = 5, f has vertical tangent, hence non-differentiable.
Doubtnut Promotions Banner Mobile Dark
|

Topper's Solved these Questions

  • GETTING STARTED WITH GRAPHS

    CENGAGE ENGLISH|Exercise Exercises 1.9|1 Videos
  • GETTING STARTED WITH GRAPHS

    CENGAGE ENGLISH|Exercise Exercises 1.10|1 Videos
  • GETTING STARTED WITH GRAPHS

    CENGAGE ENGLISH|Exercise Exercises 1.7|1 Videos
  • FUNCTIONS

    CENGAGE ENGLISH|Exercise Comprehension Type|7 Videos
  • GRAPH OF INVERSE TRIGONOMETRIC FUNCTIONS

    CENGAGE ENGLISH|Exercise Exercises|18 Videos

Similar Questions

Explore conceptually related problems
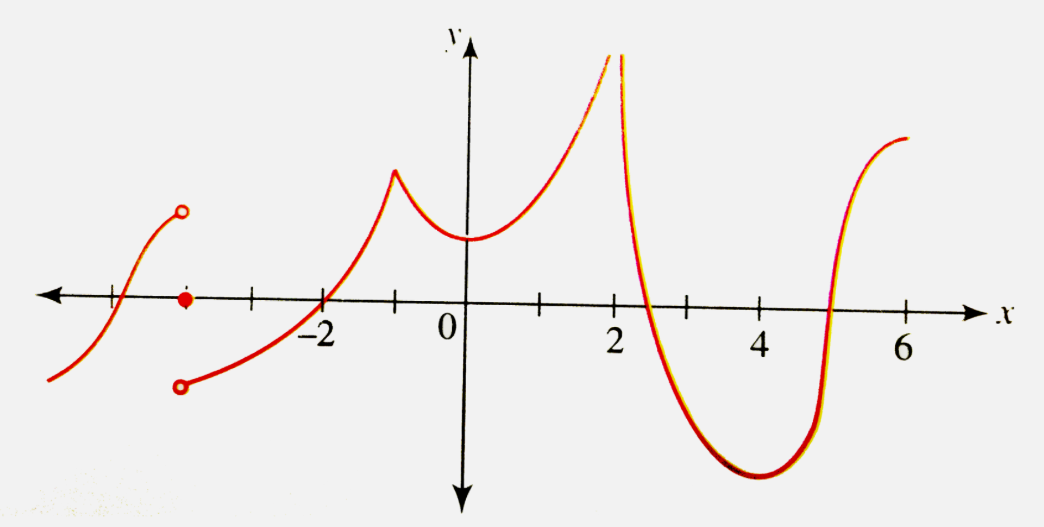
The graph of f(x) is given. State with reasons the number at which the function is non-differentiable.

The graph of y = f(x) is shown, find the number of solution of f(f(x)) = 2.

Knowledge Check

  • The graph of y = f(x) is shown to the right. If f(-1) = v , then which one of the following could be the value of f(v) ?

    A
    0
    B
    1
    C
    2
    D
    2.5
  • The graph of f(x) is shown above , Which of the following represents the graph of f(x-3) ?

    A
    B
    C
    D
  • Similar Questions

    Explore conceptually related problems

    The graph of y = f (x) is shown in the xy -plane. What is the value of f (0) ?

    The graph of the function y=f(x) is shown. Find the number of solutions to the equation ||f(x)|-1|=(1)/(2) .

    The graph of y=f(x) is shown below. If f(k)=6, then what is the minimum value of m so that f(m)=k?

    The graph of y = f(x) is given below then the graph y = |f(|x|)| is :

    The graph of a polynomial f(x) is as shown in Fig. 2.21. Write the number of real zeros of f(x) . (FIGURE)

    If graph of y= f(x) is as shown in figure, then which of the following options is/are correct?