Home
Class 12
MATHS
Graph of functions are given in the fol...

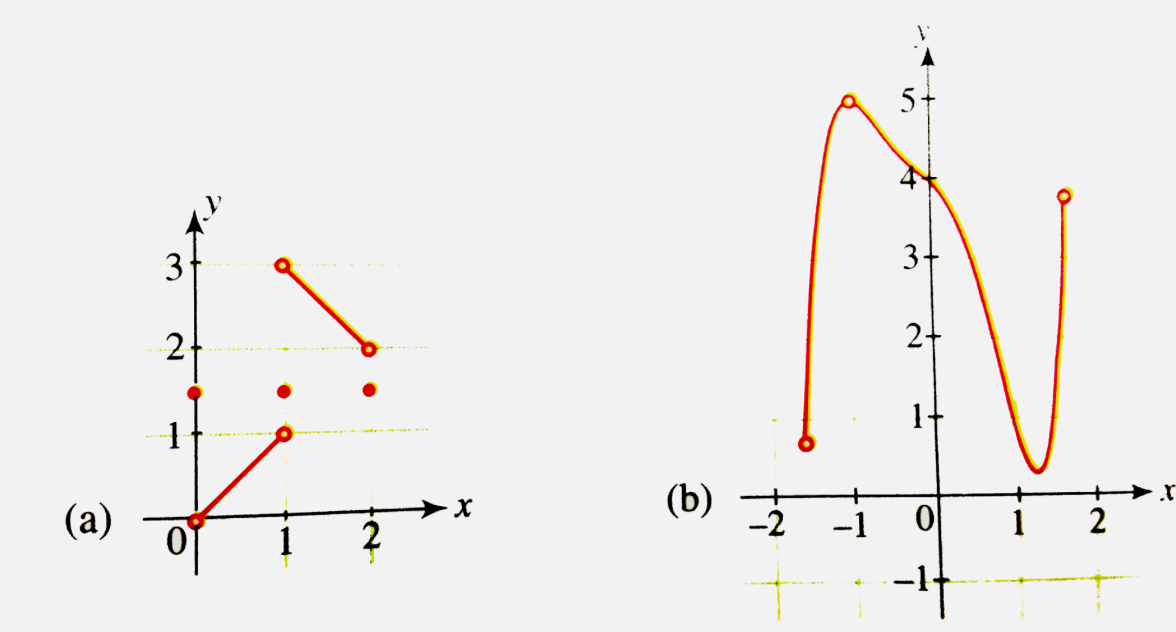
Graph of functions are given in the following figure. Check the functions for absolute extremum.

Text Solution

Verified by Experts

(a) Function has no absolute minima nor absolute maxima.
(b) Function has absolute minima but no absolute maxima.
(c) Function has local maxima at x = 0 as `f(0 - h) f(0+h) lt f(0) (=2)`.
Doubtnut Promotions Banner Mobile Dark
|

Topper's Solved these Questions

  • GETTING STARTED WITH GRAPHS

    CENGAGE ENGLISH|Exercise Exercises 1.13|1 Videos
  • GETTING STARTED WITH GRAPHS

    CENGAGE ENGLISH|Exercise Exercises 1.14|1 Videos
  • GETTING STARTED WITH GRAPHS

    CENGAGE ENGLISH|Exercise Exercises 1.11|1 Videos
  • FUNCTIONS

    CENGAGE ENGLISH|Exercise Comprehension Type|7 Videos
  • GRAPH OF INVERSE TRIGONOMETRIC FUNCTIONS

    CENGAGE ENGLISH|Exercise Exercises|18 Videos

Similar Questions

Explore conceptually related problems
The graph of functions are given in the following fingure. Discuss the symmetry.

Consider the following graphs of the functions. Check each for the extrema at x=a

Knowledge Check

  • Which of the following graphs is NOT a function ?

    A
    B
    C
    D
  • If point (a,b) lies on the graph of function f, which of the following points must lie on the graph of the inverse f?

    A
    (a,b)
    B
    (-a,b)
    C
    (a,-b)
    D
    (b,a)
  • Similar Questions

    Explore conceptually related problems
    The graph of a function is shown in the following figure. Determine the intervals on which the function is concave up and the intervals on which it is concave down. Find the x - coordinates of any inflection points.

    Does the following graph represent a function or a relation?

    Which of the following graphs are graphs of a function?

    If graph of a function f(x) which is defined in [-1, 4] is shown in the following figure then identify the correct statement(s).

    Find a formula for the function f graphed as

    The graph of the function y =f(x) . Then which of the following curve represent the graph of the function y= |f(x)|