Home
Class 12
MATHS
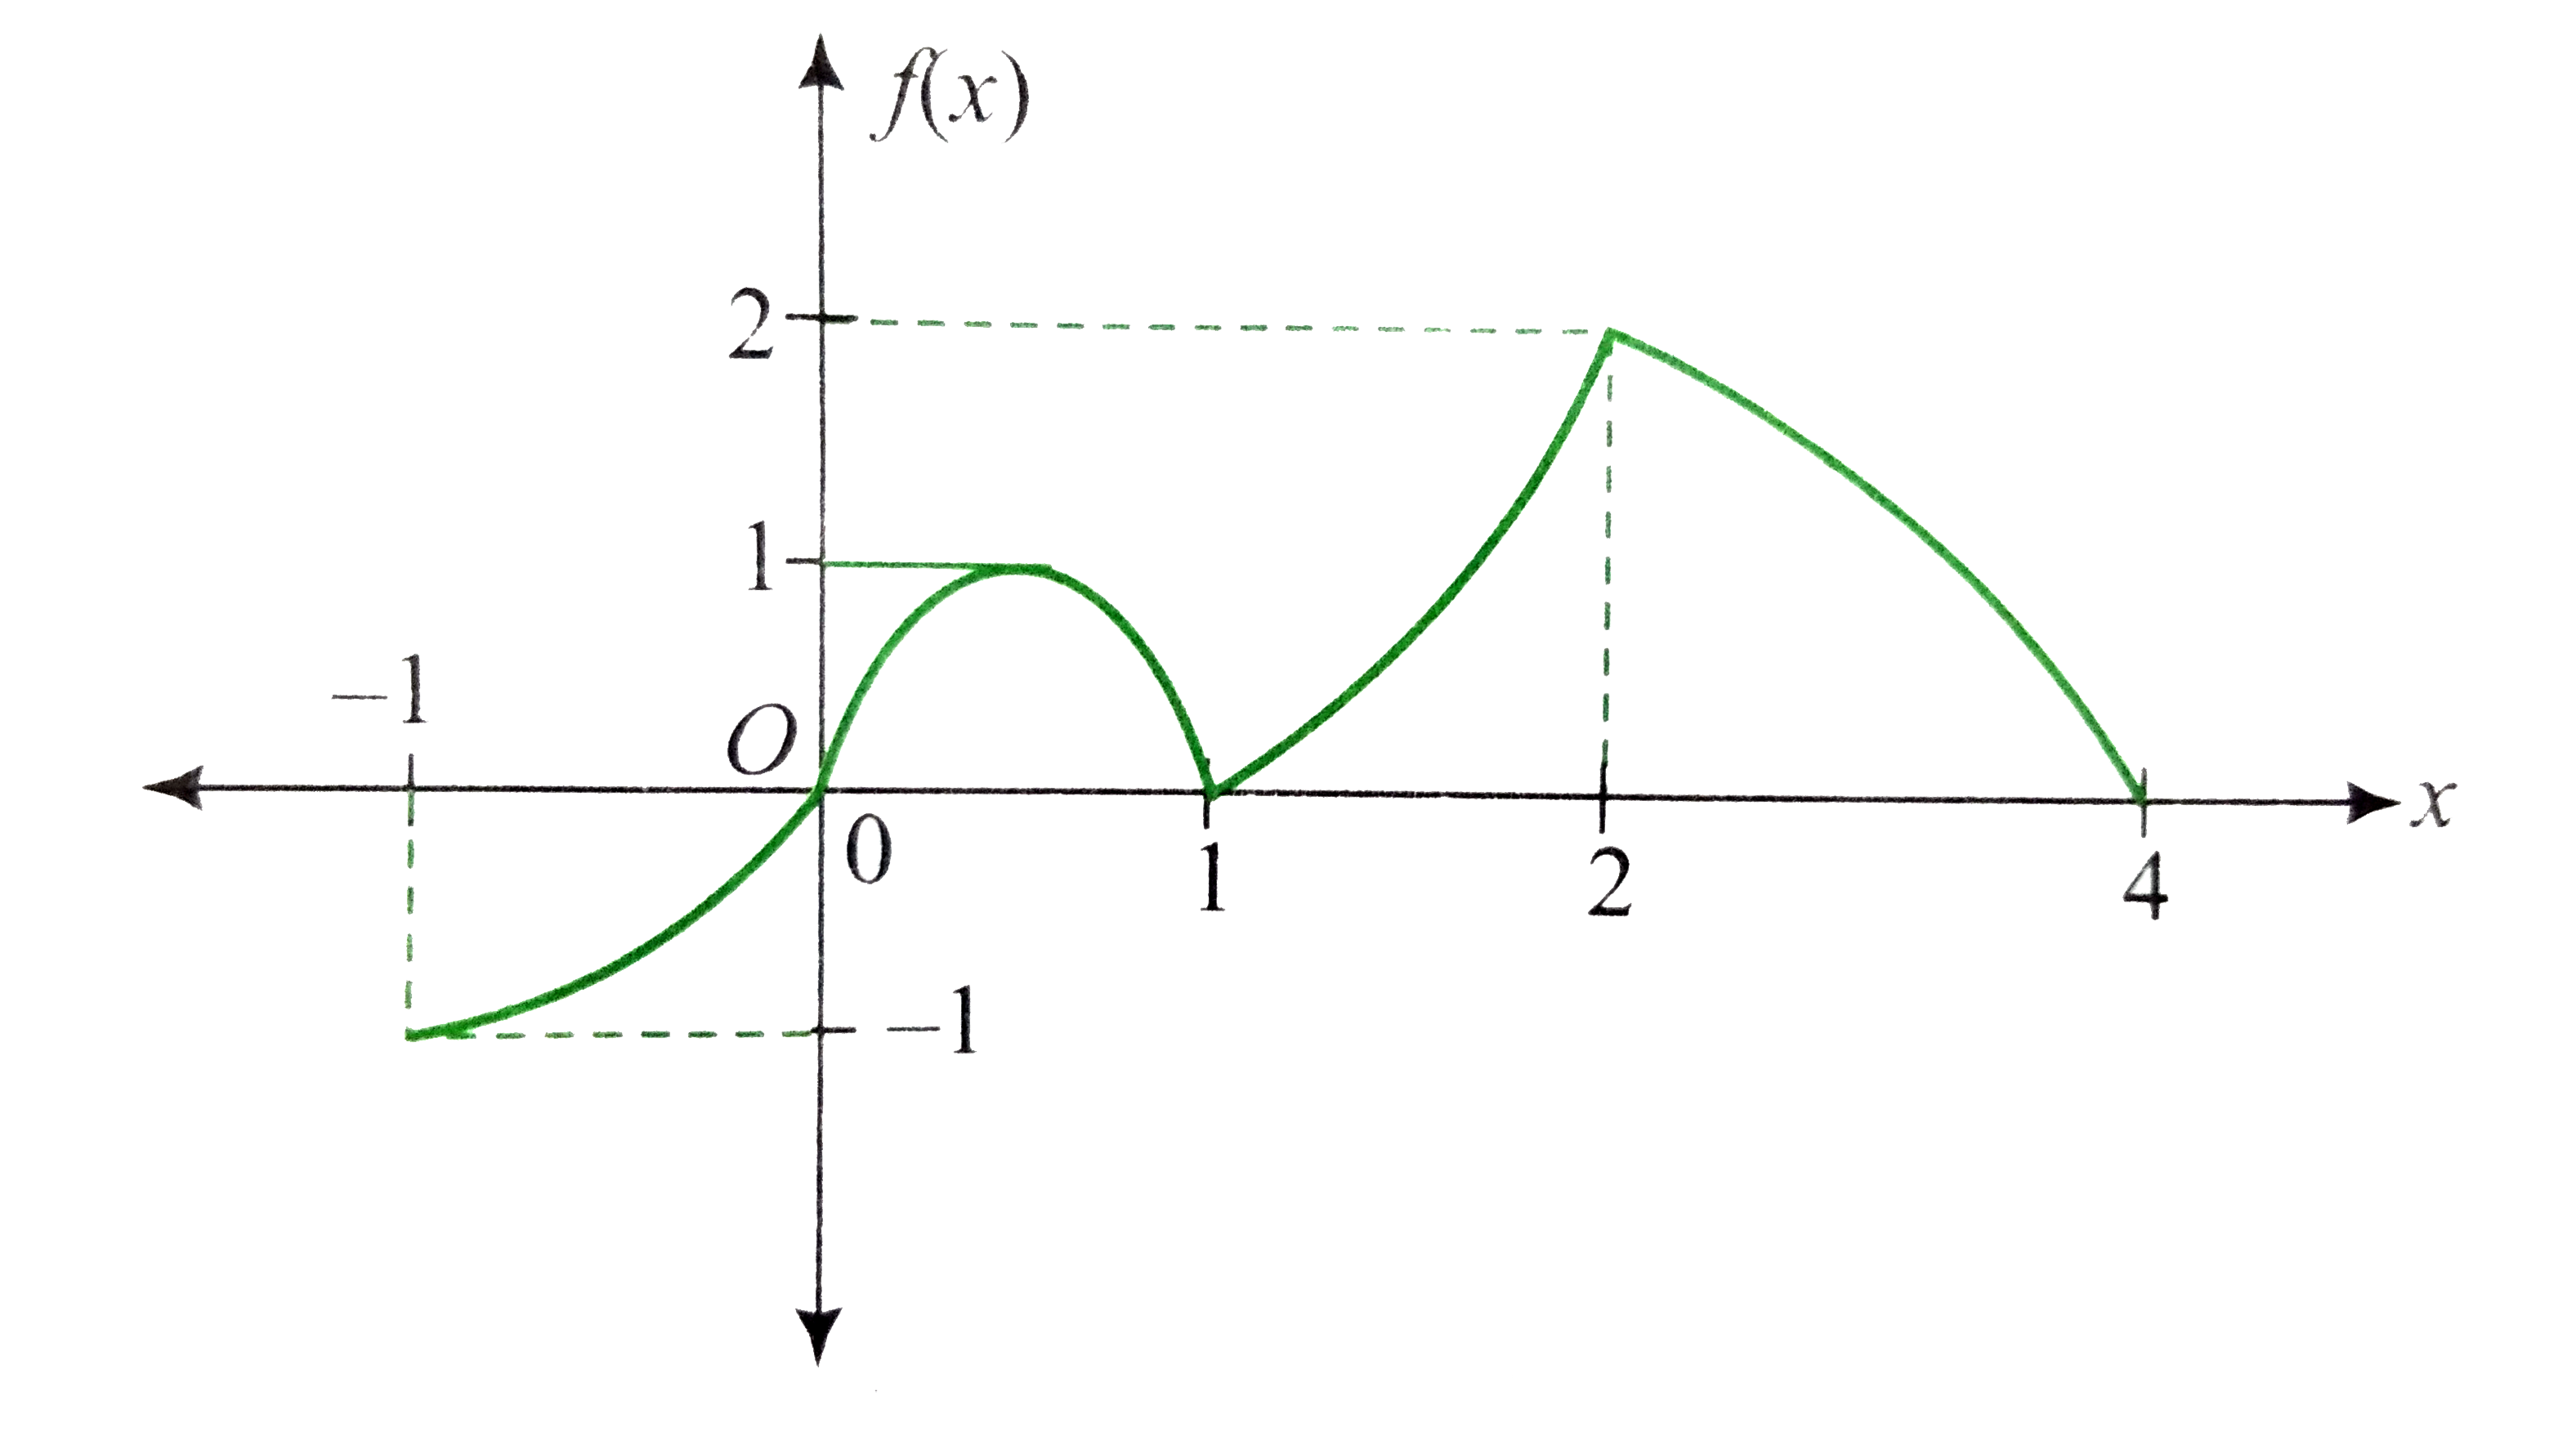
If graph of a function f(x) which is def...

If graph of a function `f(x)` which is defined in [-1, 4] is shown in the following figure then identify the correct statement(s).

A

domain of `f(|x|-1)` is `[-5,5]`

B

range of `f(|x|+1)` is `[0,2]`

C

range of `f(-|x|)` is `[-1,0]`

D

domain of `f[-3,3]`

Text Solution

Verified by Experts

The correct Answer is:
A, B, C

(a) `-1le |x|-1 le4 rArr 0 le |x| le 5 rArr -5 le x le 5`
(b) `f(|x|+1)`
range of `f(|x|+1)` is [0, 2]

range of `f(-|x|)` is `[-1,0]`

(d) `-1 le |x| le 4 rArr x in [-4, 4]`
Promotional Banner

Topper's Solved these Questions

  • FUNCTIONS

    CENGAGE ENGLISH|Exercise Comprehension Type|7 Videos
  • FUNCTIONS

    CENGAGE ENGLISH|Exercise Comprehension Type|7 Videos
  • EQUATION OF PLANE AND ITS APPLICATIONS -II

    CENGAGE ENGLISH|Exercise DPP 3.4|14 Videos
  • GETTING STARTED WITH GRAPHS

    CENGAGE ENGLISH|Exercise Exercises 1.18|1 Videos

Similar Questions

Explore conceptually related problems

The graph of a function fx) which is defined in [-1, 4] is shown in the adjacent figure. Identify the correct statement(s). (1) domain of f(|x|)-1) is [-5,5] (2) range of f(|x|+1) is [0,2] (3) range of f(-|x|) is [-1,0] (4) domain of f(|x|) is [-3,3]

For the arrangement shown in figure identify the correct statement.

The graph of the function y=f(x) is shown in the adjacent figure then correct statement is

The graph of y = f(x) is as shown in the following figure. Identify the points of discontinuity and give the reason for the same.

If f(x) is defined in -1lexle3 in the figure as shown then choose correct option

To verify Ohm's law, a student connects the voltmeter across the battery as shown in the figure. The measure voltage is plotted as a function of the current, and the following graph is obtained if V_(O) is almost zero. identify the correct statement

A function f is defined by f(x)=e^(x) sin x in [0,pi] . Which of the following is not correct?

The graph of the function y =f(x) . Then which of the following curve represent the graph of the function y= |f(x)|

Identify the parts shown in the figure given below and select the option which says the correct statement.

If graph of y= f(x) is as shown in figure, then which of the following options is/are correct?