Home
Class 9
MATHS
Find the unknown entries a,b,c,d,e and f...

Find the unknown entries a,b,c,d,e and f in the following distribution of heights of students in a class

Promotional Banner

Topper's Solved these Questions

  • SURFACE AREA AND VOLUME OF A SPHERE

    RD SHARMA ENGLISH|Exercise All Questions|140 Videos
  • TRIANGLE AND ITS ANGLES

    RD SHARMA ENGLISH|Exercise All Questions|95 Videos

Similar Questions

Explore conceptually related problems

Find the unknown entries (a,b,c,d,e,f,g) from the following frequency distribution of heights of 50 students in a class: Class intervals (heights in cm) Frequency Cumulative Frequency 150-155 155-160 160-165 165-170 170-175 175-180 12 b 10 d e 2 a 25 c 43 48 f

Identify a, b, c,d,e and f in the following table :

Identify a, b, c,d,e and f in the following table :

Find the mean of the students for the following distribution

The mean of the following distribution is 18. Find the frequency f of the class 19-21 .

The mean of the following distribution is 52 and the frequency of class interval 30-40 is f. Find f.

The following distributions represent the height of 160 studens of a class : Find the modal height

The following table shows the distribution of the heights of a group of students: Use a graph sheet to draw an Ogive for the distribution. Use the Ogive to find: the number of students whose height is more than 168 cm

The following table shows the distribution of the heights of a group of students: Use a graph sheet to draw an Ogive for the distribution. Use the Ogive to find: the number of students whose height is less than 148 cm.

The following table shows the distribution of the heights of a group of students: Use a graph sheet to draw an Ogive for the distribution. Use the Ogive to find: the inter quartile range

RD SHARMA ENGLISH-TABULAR REPRESENTATION OF STATISTICAL DATA -All Questions
  1. The following table gives the marks scored by 378 students in an ent...

    Text Solution

    |

  2. A cumulative frequency distribution is given below. Convert this in...

    Text Solution

    |

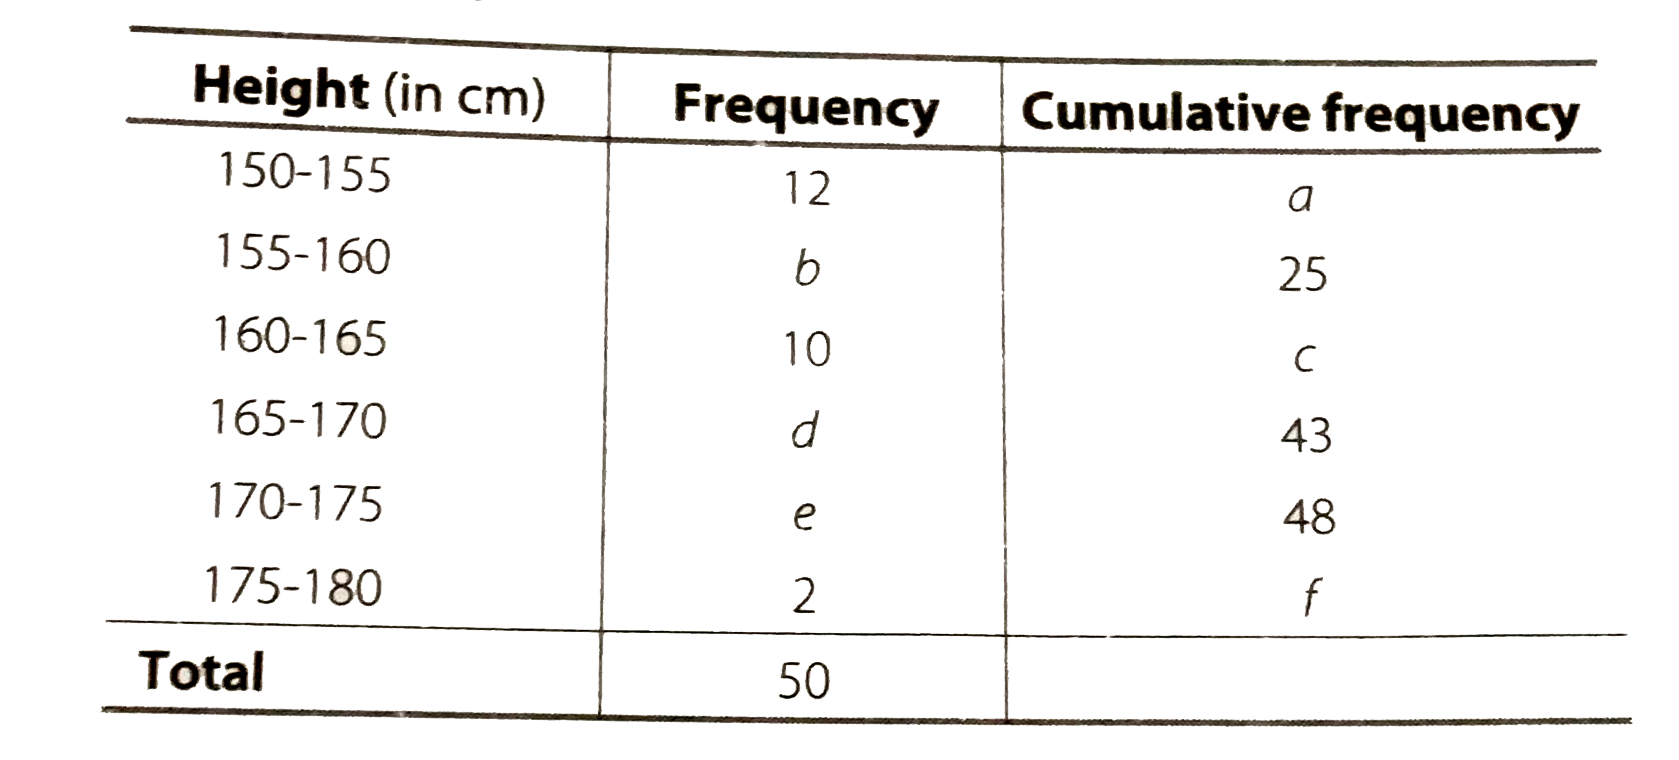
  3. Find the unknown entries a,b,c,d,e and f in the following distribution...

    Text Solution

    |

  4. Cumulative Frequency Distribution

    Text Solution

    |

  5. Explain the difference between a frequency distribution and a cumul...

    Text Solution

    |

  6. The marks scored by 55 students in a test are given below: Marks   ...

    Text Solution

    |

  7. The water bills (in rupees) of 32 houses in a certain street for the...

    Text Solution

    |

  8. The number of books in different shelves of a library are as follow...

    Text Solution

    |

  9. Given below are the cumulative frequencies showing the weights of 68...

    Text Solution

    |

  10. The following cumulative frequency distribution table shows the dail...

    Text Solution

    |

  11. Given below is a cumulative frequency distribution table showing th...

    Text Solution

    |

  12. Tally marks are used to find (a) class interval           (b)  range...

    Text Solution

    |

  13. The difference between the highest and lowest values of the observat...

    Text Solution

    |

  14. The difference between the upper and the lower class limits is calle...

    Text Solution

    |

  15. Define mean.

    Text Solution

    |

  16. In a frequency distribution, the mid-value of a class is 15 and the...

    Text Solution

    |

  17. The mid-value of a class interval is 42. If the class size is 10, th...

    Text Solution

    |

  18. The number of times a particular item occurs in a given data is call...

    Text Solution

    |

  19. The width of each of nine classes in a frequency distribution is 2.5...

    Text Solution

    |

  20. Let l be the lower class limit of a class-interval in a frequency di...

    Text Solution

    |